. 2015 Apr;167(4):1471-86.
doi: 10.1104/pp.114.254623. Epub 2015 Feb 11.

ALTERED MERISTEM PROGRAM1 suppresses ectopic stem cell niche formation in the shoot apical meristem in a largely cytokinin-independent manner

Affiliations

ALTERED MERISTEM PROGRAM1 suppresses ectopic stem cell niche formation in the shoot apical meristem in a largely cytokinin-independent manner

Wenwen Huang et al. Plant Physiol. 2015 Apr.

Abstract

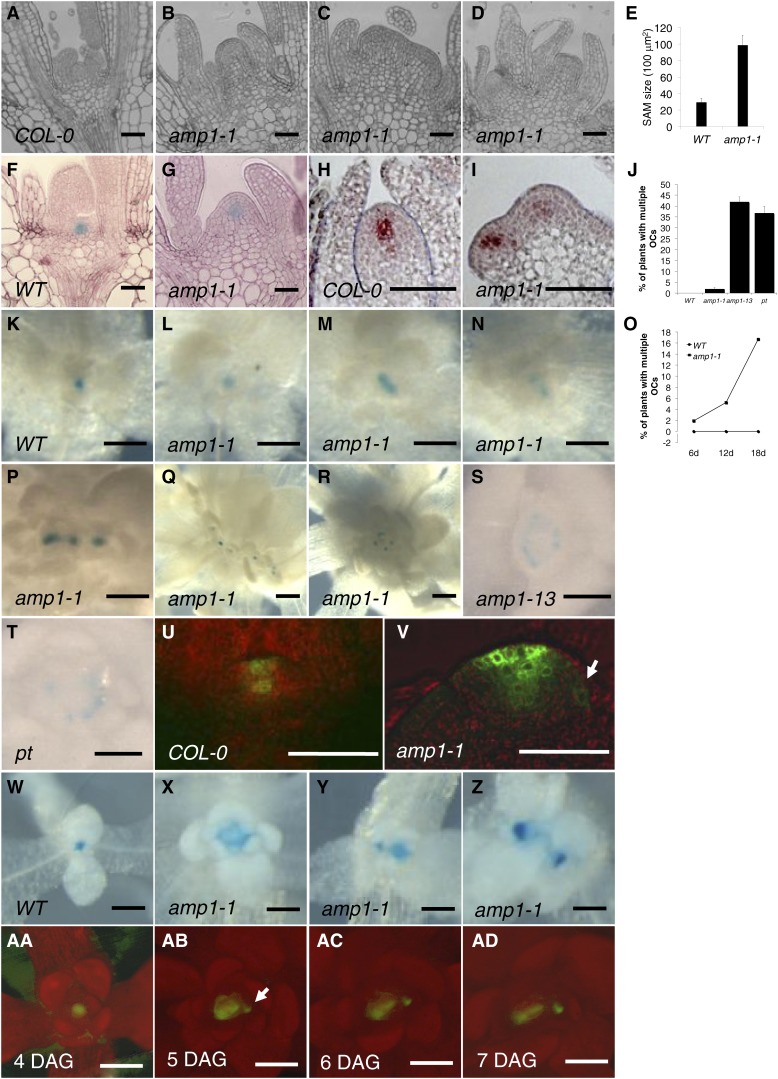
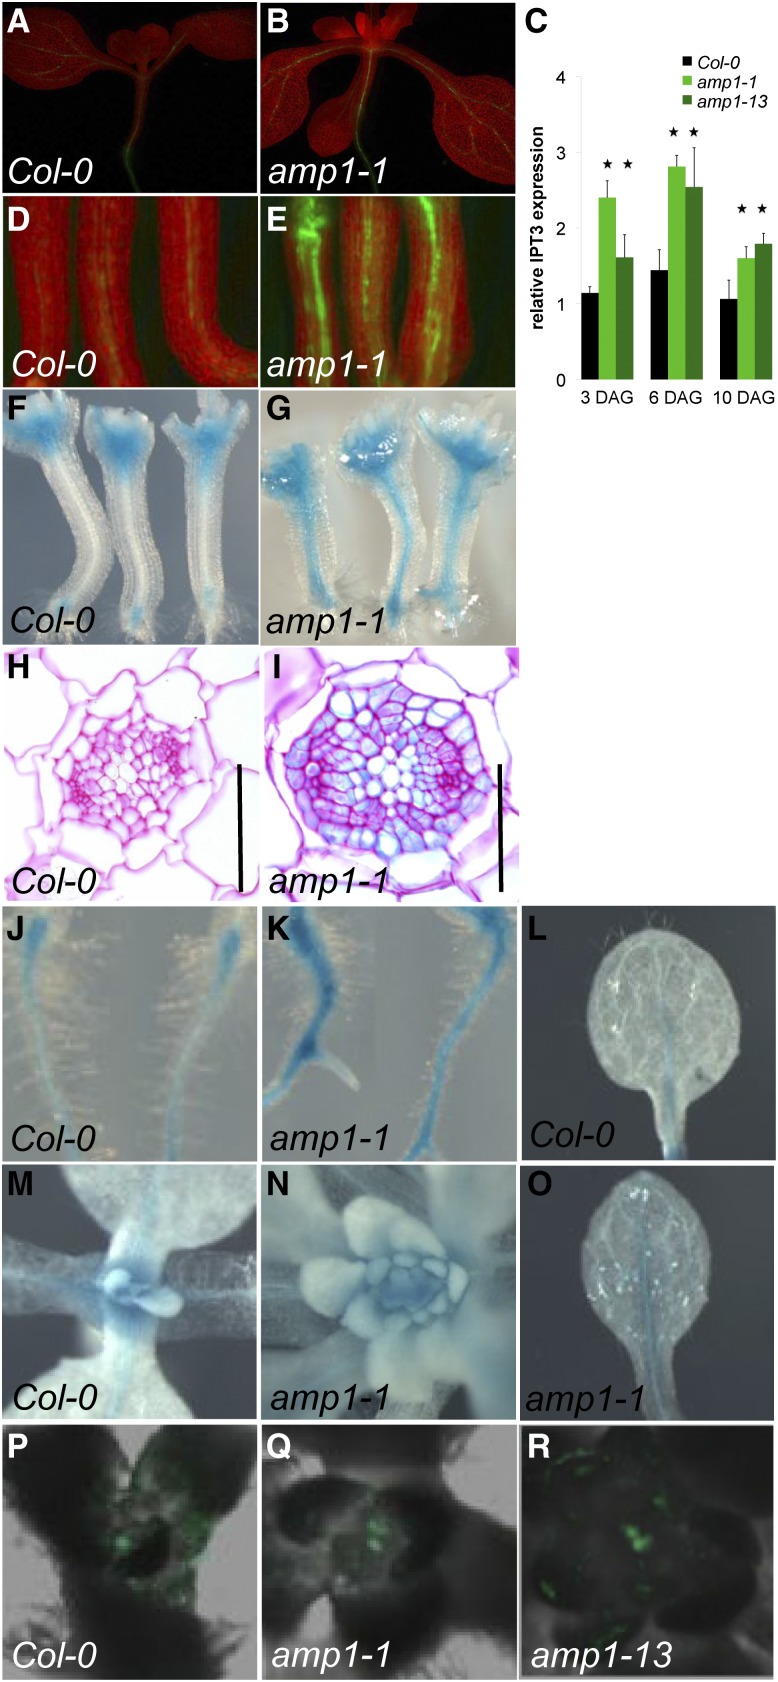
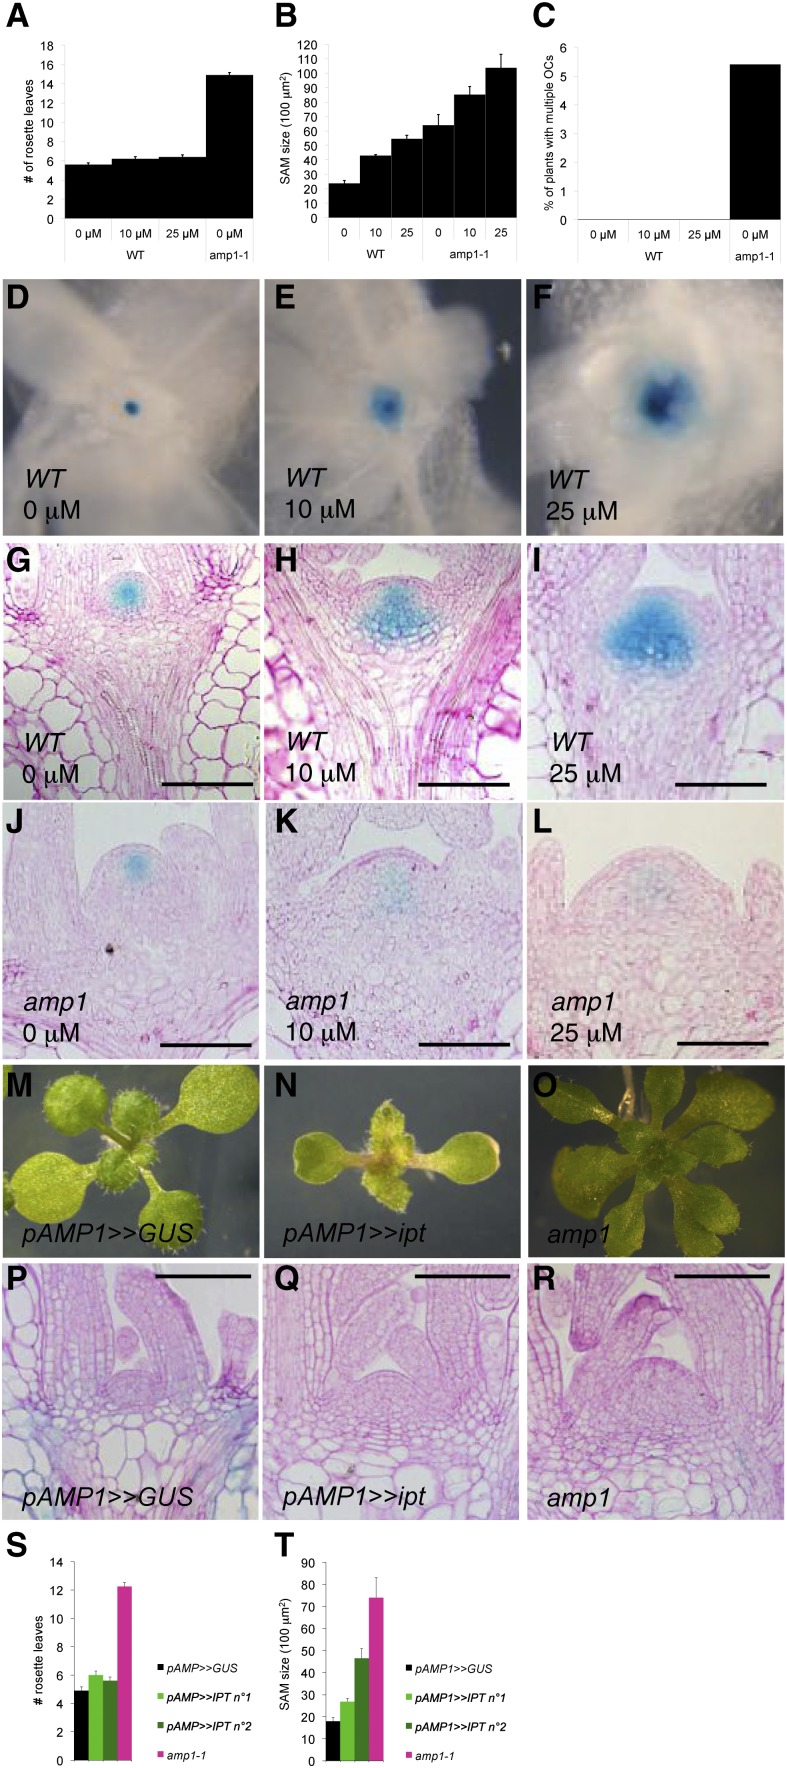
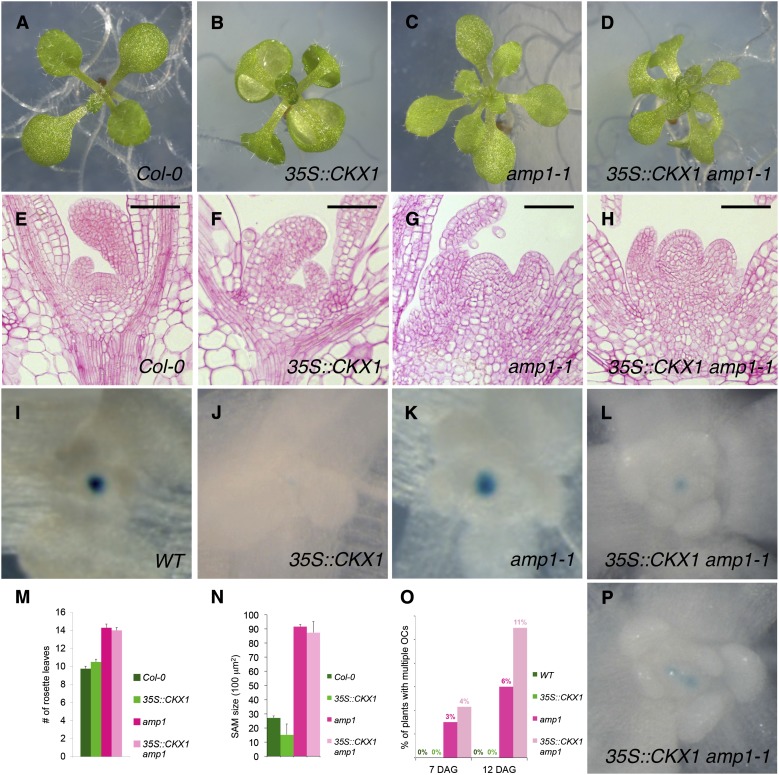
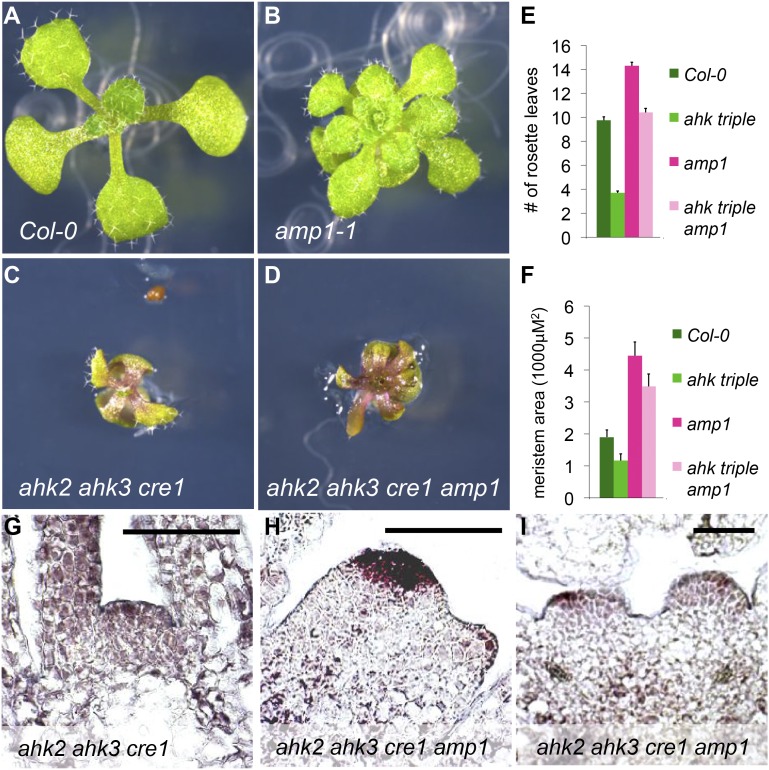
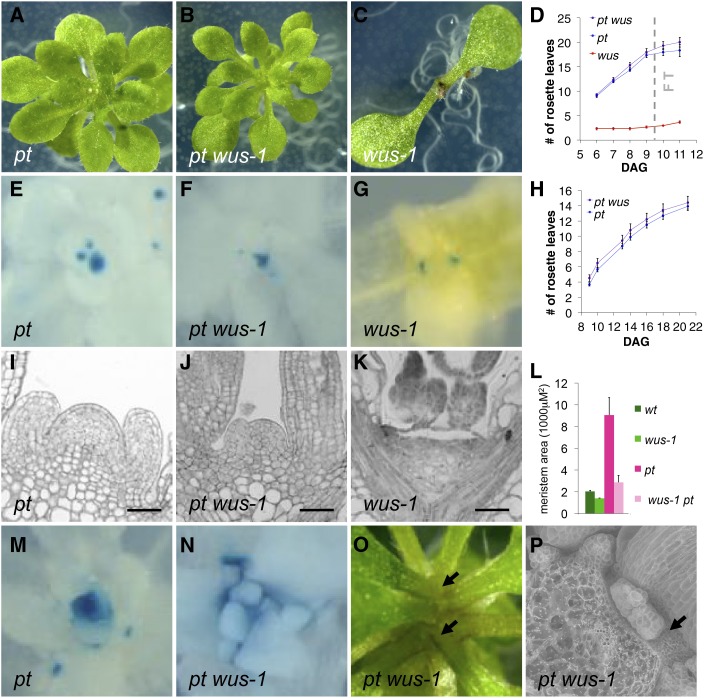
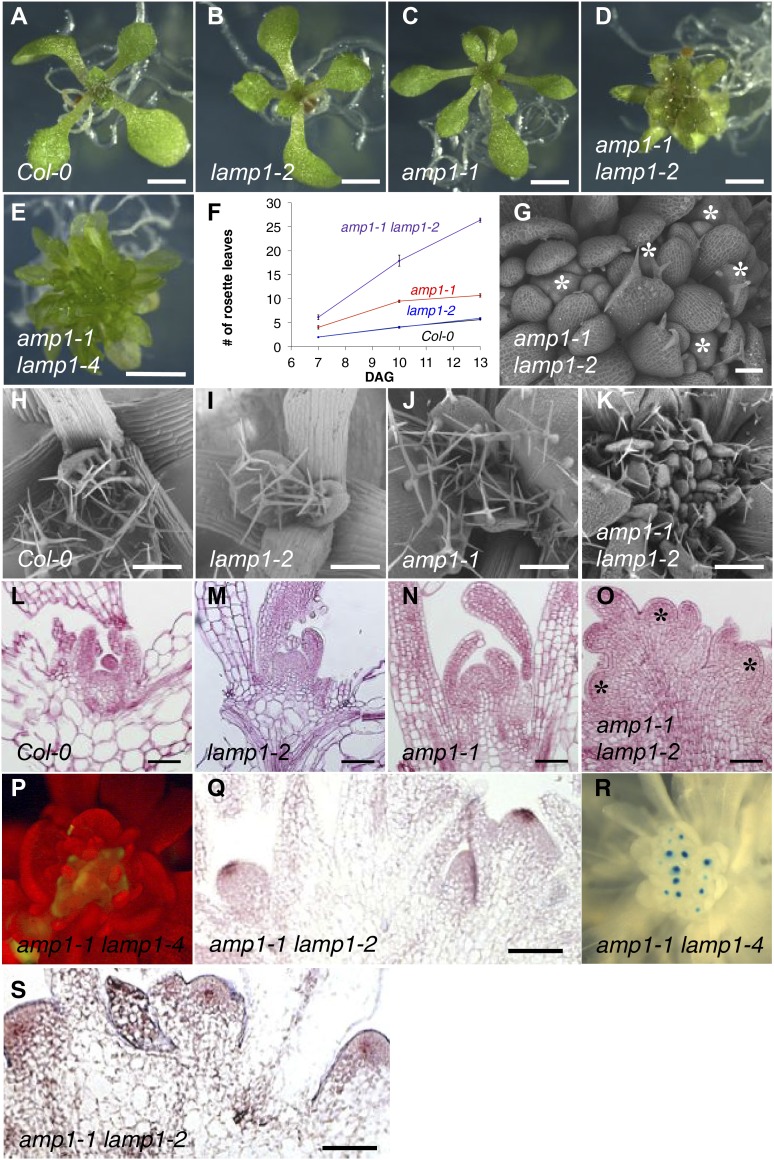
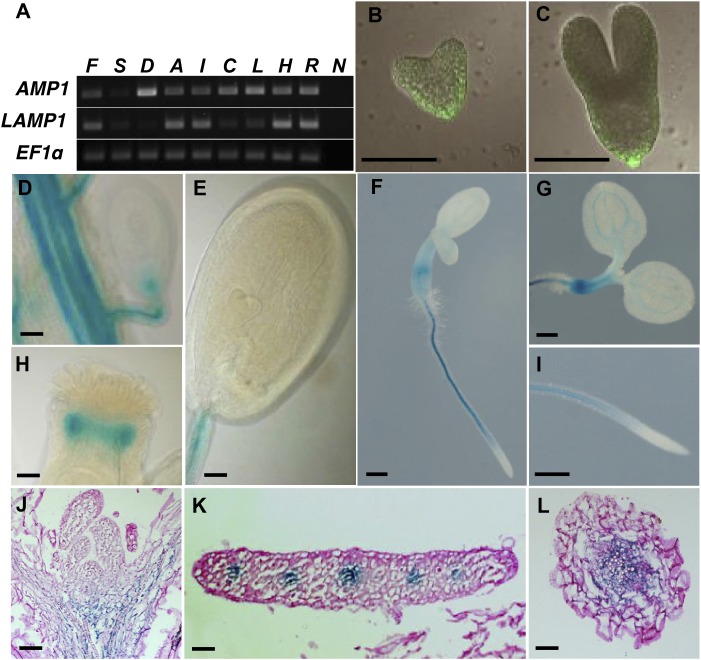
Plants are able to reiteratively form new organs in an environmentally adaptive manner during postembryonic development. Organ formation in plants is dependent on stem cell niches (SCNs), which are located in the so-called meristems. Meristems show a functional zonation along the apical-basal axis and the radial axis. Shoot apical meristems of higher plants are dome-like structures, which contain a central SCN that consists of an apical stem cell pool and an underlying organizing center. Organ primordia are formed in the circular peripheral zone (PZ) from stem cell descendants in which differentiation programs are activated. One mechanism to keep this radial symmetry integrated is that the existing SCN actively suppresses stem cell identity in the PZ. However, how this lateral inhibition system works at the molecular level is far from understood. Here, we show that a defect in the putative carboxypeptidase ALTERED MERISTEM PROGRAM1 (AMP1) causes the formation of extra SCNs in the presence of an intact primary shoot apical meristem, which at least partially contributes to the enhanced shoot meristem size and leaf initiation rate found in the mutant. This defect appears to be neither a specific consequence of the altered cytokinin levels in amp1 nor directly mediated by the WUSCHEL/CLAVATA feedback loop. De novo formation of supernumerary stem cell pools was further enhanced in plants mutated in both AMP1 and its paralog LIKE AMP1, indicating that they exhibit partially overlapping roles to suppress SCN respecification in the PZ.


Figures

Figure 1.
Figure 1.
amp1 SAMs form ectopic SCNs. A to D, Median longitudinal SAM sections of seedlings at 6 DAG. A, The ecotype Columbia wild type (WT). B, amp1-1 single SAM with increased size. C, amp1-1 SAM forming an ectopic SCN. D, amp1-1 shoot apex with two independent SCNs. E, Quantification of SAM size from median longitudinal sections at 6 DAG (means ± se of the mean; n ≥ 3). F and G, WUS::GUS localization in median longitudinal SAM sections of the wild type (F) and amp1-1 (G) at 6 DAG. H and I, In situ hybridization showing WUS expression in median longitudinal SAM sections at 9 DAG. H, Wild-type SAM with the typical central WUS expression domain defining the OC. I, amp1-1 SAM showing two distinct WUS expression domains in close neighborhood. J, Percentage of plants with multiple OCs at 6 DAG in different amp1 alleles (means ± se of the mean from three experimental repeats; n ≥ 200 for each repeat). K to N and P to T, WUS::GUS localization in SAMs of different amp1 alleles at different developmental stages grown under short-day conditions to avoid floral transition. K, The wild type (6 DAG). L, amp1-1 (6 DAG) with a single diffuse OC. M, amp1-1 (6 DAG) showing band-like expansion of WUS domain. N, amp1-1 (6 DAG) with two distinct WUS foci. P, amp1-1 (12 DAG) showing three distinct OCs. Q and R, amp1-1 (18 DAG). S, amp1-13 (6 DAG). T, pt (6 DAG). O, Ontogenetic increase in OC numbers in amp1-1. Percentage of plants with multiple SAM OCs at the indicated developmental stage (n ≥ 200, per developmental stage). U and V, CLV3::GFP reporter analysis in median longitudinal cryo sections of 6-d-old SAMs. U, The wild type. V, amp1-1. The arrow indicates lateral expansion of CLV3::GFP signal in the L1 layer. W to Z, CLV3::GUS localization in SAMs of plants grown under short-day conditions to avoid floral transition at 12 DAG. W, The wild type. X, Overlapping stem cell pools in a radial constellation in amp1-1. Y, Formation of ectopic stem cell pool in close proximity of the primary SCN. Z, Twin SAM with similar-sized CLV3::GUS foci in amp1-1. AA to AD, CLV3::GFP time lapse analysis of a pt SAM between 4 and 7 DAG showing expansion of the original stem cell pool and de novo formation of ectopic stem cells (white arrow). Bars = 50 μm (A–D, F–I, U, and V) and 200 μm (K–N, P–T, and W–AD).
Figure 2.
Figure 2.
Tissue-specific expression analysis of IPT3 and CK response markers in amp1. A, B, D, and E, IPT3::GFP reporter analysis in 7-d-old wild-type (A and D) and amp1-1 (B and E) seedlings. D and E show hypocotyl region of three individual plants. C, Expression analysis of IPT3 in the wild type and amp1 by qRT-PCR. Relative transcript levels (mean ± sd) were calculated from triplicate qRT-PCR reactions of independent RNA samples prepared from three different sets of seedlings for each developmental stage. Relative expression is normalized to glyceraldehyde 3-phosphate dehydrogenase C2 (GAPC2). Asterisks indicate statistical significance (P < 0.05, n = 3). F to O, ARR5::GUS analysis in 7-d-old seedlings. Hypocotyls of the wild type (F) and amp1-1 (G). Transversal section of the vascular cylinder from the central hypocotyl of the wild type (H) and amp1-1 (I). J, Top root of the wild type. K, amp1-1. SAM area of the wild type (M) and amp1-1 (N). L, True leaf of the wild type. O, True leaf of amp1-1. P to R, TCS::GFP analysis in SAMs of 7-d-old seedlings. P, The wild type with one central TCS::GFP domain. amp1-1 (Q) and amp1-13 (R) show two distinct TCS::GFP foci in one SAM. Bars = 50 μm.
Figure 3.
Figure 3.
Exogenous CK application or endogenous increase of CK biosynthesis do not phenocopy amp1 SAM phenotypes A, Number of visible rosette leaves in wild-type (WT) plants treated with the indicated concentrations of transzeatin compared with untreated amp1-1 at 18 DAG under short-day conditions ( means ± se of the mean; n ≥ 10). B, Quantification of SAM size in the wild type and amp1-1 at 7 DAG after treatment with indicated concentrations of transzeatin (μm). Area of median longitudinal sections was measured (means ± se of the mean; n ≥ 5). C, Percentage of wild-type plants with multiple WUS::GUS foci after treatment with the indicated concentrations of transzeatin compared with untreated amp1-1 plants. Plants were grown under short-day conditions and were analyzed at 12 DAG (n ≥ 200). D to F, WUS::GUS expression domain in wild-type plants treated with 0 μm (D), 10 μm (E), or 25 μm (F) transzeatin at 7 DAG. G to L, WUS::GUS localization in median longitudinal SAM sections of the wild type (G–I) and amp1-1 (J–L) at 7 DAG. Plants were treated with 0 μm (G and J), 10 μm (H and K), or 25 μm (I and L) transzeatin. M to O, Shoot phenotypes of representative pAMP1>>GUS (M), pAMP1>>ipt (N), and amp1-1 (O) seedlings at 9 DAG. P to R, Median longitudinal SAM sections of pAMP1>>GUS (P), pAMP1>>ipt (Q), and amp1-1 (R) seedlings at 9 DAG. S, Quantification of rosette leaf number in pAMP1>>GUS (control), two independent pAMP1>>ipt lines, and amp1-1 at 9 DAG (means ± se of the mean; n ≥ 10). T, Quantification of SAM size in pAMP1>>GUS (control), two independent pAMP1>>ipt lines, and amp1-1 at 9 DAG (means ± se of the mean; n ≥ 3). Bars = 100 μm.
Figure 4.
Figure 4.
Effect of reduced CK levels on amp1 shoot meristem phenotypes. A to D, Shoot phenotypes of representative Col-0 (A), 35S::CKX1 (B), amp1-1 (C), and 35S::CKX1 amp1-1 (D) seedlings at 9 DAG. E to H, Median longitudinal SAM sections of Col-0 (E), 35S::CKX1 (F), amp1-1 (G), and 35S::CKX1 amp1-1 (H) seedlings 9 DAG. I to L and P, WUS::GUS localization in SAMs of Col-0 (I), 35S::CKX1 (J), amp1-1 (K), and 35S::CKX1 amp1-1 (L and P) seedlings at 7 DAG. M, Quantification of rosette leaf number of indicated genotypes grown under short-day conditions at 12 DAG (means ± se of the mean; n ≥ 10). N, SAM size measurement of indicated genotypes at 9 DAG (means ± se of the mean; n ≥ 3). O, Quantification of ectopic OC formation in indicated genotypes at 7 and 12 DAG (n ≥ 200). WT, Wild type. Bars = 50 μm.
Figure 5.
Figure 5.
Effect of CK insensitivity on amp1 shoot meristem phenotypes. A to D, Shoot phenotypes of representative Col-0 (A), amp1-1 (B), ahk2-2 ahk3-3 cre1-12 (C), and ahk2-2 ahk3-3 cre1-12 amp1-1 (D) seedlings 9 DAG. E, Quantification of rosette leaf number of indicated genotypes grown under short day at 12 DAG (means ± se of the mean; n ≥ 10). F, SAM size measurement of indicated genotypes grown under short day at 11 DAG (means ± se of the mean; n ≥ 3). G to I, RNA in situ hybridization showing CLV3 expression in median longitudinal SAM sections (at 11 DAG) grown under short day. G, For ahk2-2 ahk3-3 cre1-12, CLV3 expression is barely detectable. H, ahk2-2 ahk3-3 cre1-12 amp1-1 SAM with a large central CLV3 expression domain and a peripheral CLV3 positive area. I, ahk2-2 ahk3-3 cre1-12 amp1-1 shoot apex with two CLV3-expressing SAM poles of similar size. Bars = 50 μm.
Figure 6.
Figure 6.
Genetic interaction between AMP1 and WUS. A to C, Shoot phenotypes of pt (A), pt wus-1 (B), and wus-1 (C) seedlings at 10 DAG. D, Appearance of visible leaves in pt, pt wus-1, and wus-1 grown under long days (means ± se of the mean; n ≥ 10). Time point at which pt undergoes floral transition is indicated as dashed vertical line. E to G, WUS::GUS activity in 7-d-old shoots of pt (E), pt wus-1 (F), and wus-1 (G). H, Appearance of visible leaves in pt and pt wus-1 grown under short days (means ± se of the mean; n ≥ 10). I to K, Median longitudinal SAM sections of pt (I), pt wus-1 (J), and wus-1 (K) at 7 DAG. L, Quantification of SAM area in 7-d-old plants (means ± se of the mean; n ≥ 3). M and N, CLV3::GUS activity in 7-d-old shoots of pt (M) and pt wus-1 (N). O, Shoot apex of 15-d-old pt wus-1 grown under long days. An inflorescence meristem was not formed, and arrows point at leaves derived from two meristem poles. P, Scanning electron micrograph of shoot apex from 15-d-old pt wus-1 grown under long days. One leaf was removed for better visibility of differentiated areas between leaves. No obvious inflorescence meristem structures could be observed between the bases of the youngest leaves (arrow). Bars = 50 μm.
Figure 7.
Figure 7.
Analysis of amp1 lamp1 phenotype. A to E, Shoot phenotypes of wild-type Col-0 (A), lamp1-2 (B), amp1-1 (C), amp1-1 lamp1-2 (D), and amp1-1 lamp1-4 (E) seedlings at 9 DAG. F, Number of visible rosette leaves quantified at days 7, 10, and 13 (means ± se of the mean; n ≥ 10). G to K, Scanning electron micrographs of SAM areas from 9-d-old wild-type Col-0 (H), lamp1-2 (I), amp1-1 (J), and amp1-1 lamp1-2 (K). G, Close-up of amp1-1 lamp1-2 shoot apex showing multiple independent functional SAM domes (asterisks). L to O, Median longitudinal SAM sections of seedlings at 7 DAG. Wild-type Col-0 (L), lamp1-2 (M), amp1-1 (N), and amp1-1 lamp1-2 (O) showing ectopic SCNs (asterisks). P, CLV3::GFP localization in amp1-1 lamp1-4 at 7 DAG. Q, In situ hybridization showing CLV3 expression in median longitudinal SAM sections of amp1-1 lamp1-2 at 9 DAG. R, WUS::GUS localization in 14-d-old amp1-1 lamp1-4 grown under short-day conditions. S, RNA in situ hybridization showing WUS expression in median longitudinal SAM sections of amp1-1 lamp1-2 at 9 DAG. Bars = 2,000 μm (A–G), 250 μm (H–K), and 50 μm (G, L–O, Q, and S).
Figure 8.
Figure 8.
Tissue-specific expression patterns of AMP1 and LAMP1. A, Semiquantitative reverse transcription-PCR analysis comparing expression levels of AMP1 and LAMP1 in different tissues. ELONGATION FACTOR 1α (EF1α) was used as normalization control. B and C, AMP1::AMP1-GFP localization in heart stage embryo (B) and torpedo stage embryo (C). D to I, Whole-mount analysis of pLAMP1::GUS activity in the vascular tissue of the placenta and the funiculus and in the micropylar pole of the ovule (D), developing seed with heart stage embryo (E), 3-d-old seedling (F, G, and I), and style (H). J to L, pLAMP1::GUS localization in median longitudinal section of the shoot apex (J) and transversal sections of true leaf (K) and hypocotyl (L). F, Flowers; S, siliques; D, dry seeds; A, axillary buds; I, inflorescence stems; C, cauline leaves; L, rosette leaves; H, hypocotyl; R, roots; N, no cDNA added. Bars = 50 μm (B–E, H, and J–L) and 300 μm (F, G, and I).

References

    1. Aichinger E, Kornet N, Friedrich T, Laux T (2012) Plant stem cell niches. Annu Rev Plant Biol 63: 615–636 - PubMed
    1. Barton MK. (2010) Twenty years on: the inner workings of the shoot apical meristem, a developmental dynamo. Dev Biol 341: 95–113 - PubMed
    1. Bennett T, Sieberer T, Willett B, Booker J, Luschnig C, Leyser O (2006) The Arabidopsis MAX pathway controls shoot branching by regulating auxin transport. Curr Biol 16: 553–563 - PubMed
    1. Bollman KM, Aukerman MJ, Park MY, Hunter C, Berardini TZ, Poethig RS (2003) HASTY, the Arabidopsis ortholog of exportin 5/MSN5, regulates phase change and morphogenesis. Development 130: 1493–1504 - PubMed
    1. Brand U, Fletcher JC, Hobe M, Meyerowitz EM, Simon R (2000) Dependence of stem cell fate in Arabidopsis on a feedback loop regulated by CLV3 activity. Science 289: 617–619 - PubMed

Publication types

MeSH terms