. 2015 Apr;14(4):865-76.
doi: 10.1158/1535-7163.MCT-14-0845. Epub 2015 Feb 11.

Functional Genetic Screen Identifies Increased Sensitivity to WEE1 Inhibition in Cells with Defects in Fanconi Anemia and HR Pathways

Affiliations

Functional Genetic Screen Identifies Increased Sensitivity to WEE1 Inhibition in Cells with Defects in Fanconi Anemia and HR Pathways

Marieke Aarts et al. Mol Cancer Ther. 2015 Apr.

Abstract

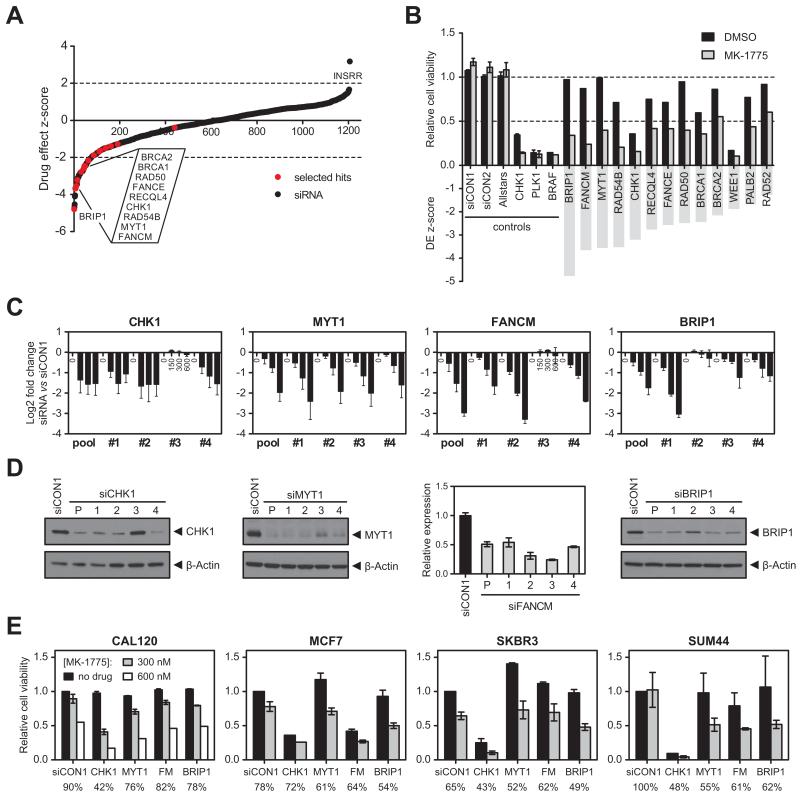
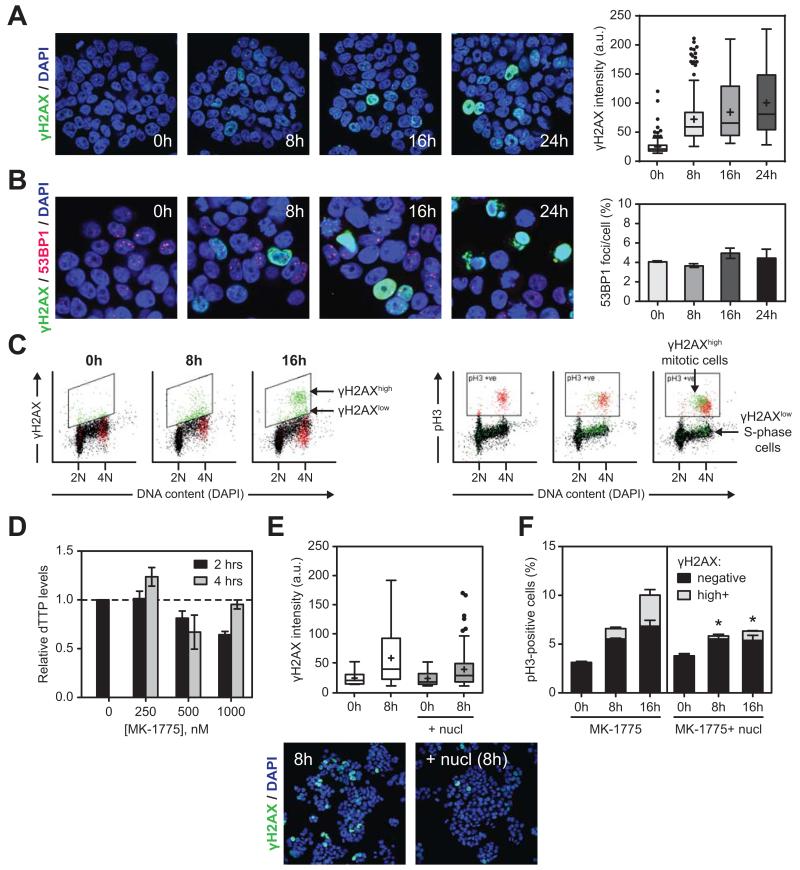
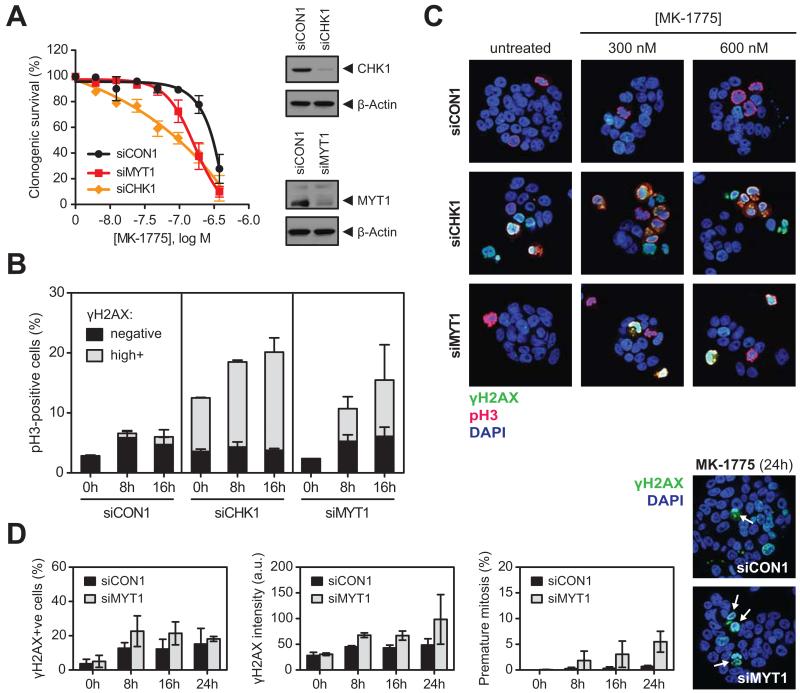
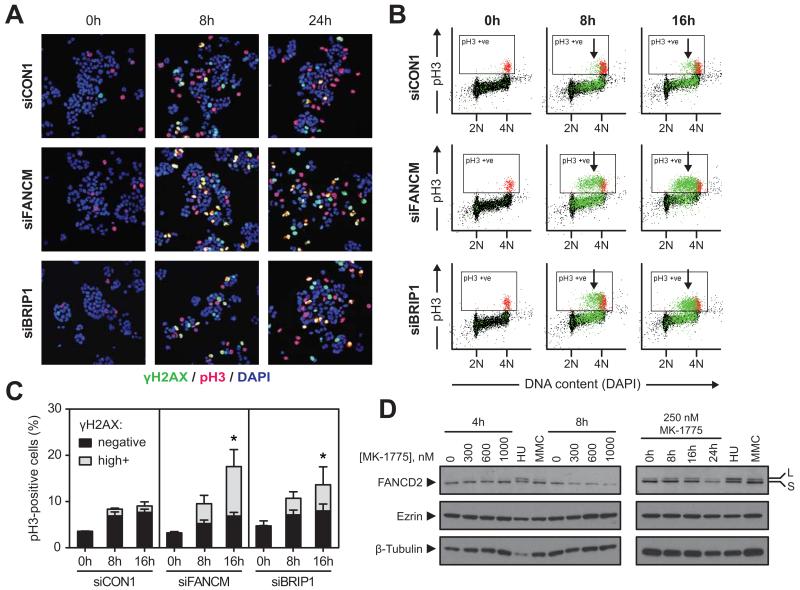
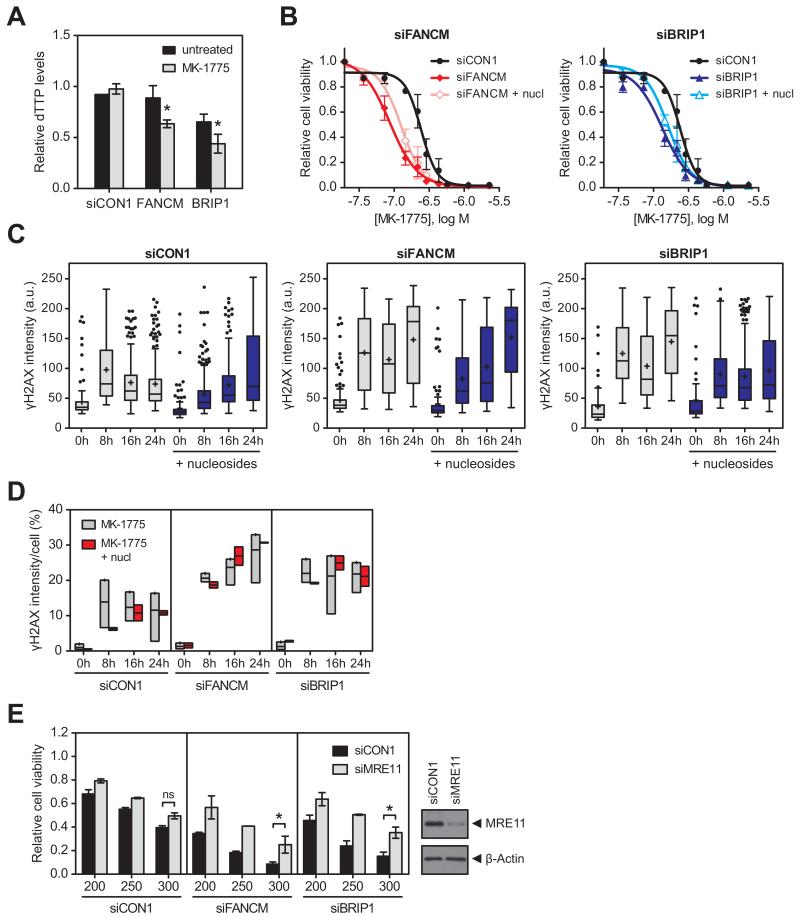
WEE1 kinase regulates CDK1 and CDK2 activity to facilitate DNA replication during S-phase and to prevent unscheduled entry into mitosis. WEE1 inhibitors synergize with DNA-damaging agents that arrest cells in S-phase by triggering direct mitotic entry without completing DNA synthesis, resulting in catastrophic chromosome fragmentation and apoptosis. Here, we investigated how WEE1 inhibition could be best exploited for cancer therapy by performing a functional genetic screen to identify novel determinants of sensitivity to WEE1 inhibition. Inhibition of kinases that regulate CDK activity, CHK1 and MYT1, synergized with WEE1 inhibition through both increased replication stress and forced mitotic entry of S-phase cells. Loss of multiple components of the Fanconi anemia (FA) and homologous recombination (HR) pathways, in particular DNA helicases, sensitized to WEE1 inhibition. Silencing of FA/HR genes resulted in excessive replication stress and nucleotide depletion following WEE1 inhibition, which ultimately led to increased unscheduled mitotic entry. Our results suggest that cancers with defects in FA and HR pathways may be targeted by WEE1 inhibition, providing a basis for a novel synthetic lethal strategy for cancers harboring FA/HR defects.


Figures

Figure 1
Figure 1. siRNA screen identifies novel determinants of WEE1 inhibitor sensitivity A
Drug effect Z-scores for an siRNA/MK-1775 WEE1 inhibitor sensitivity screen in WiDr cells. Z-scores <−2 represent statistically significant sensitising effects to 200 nM MK-1775 (dotted line). Black dots, individual siRNA SMARTpools targeting 1206 genes; red dots, hits selected for further validation. B. Relative cell viability (top) and drug effect (DE) Z-scores (bottom) for selected hits from the siRNA screen after treatment with DMSO (black bars) or MK-1775 (grey bars). siCON1, siCON2 and Allstars were included as non-targeting controls; siCHK1, siPLK1 and siBRAF were included as transfection controls. C. Sensitisation to MK-1775 was validated with four individual siRNA duplexes targeting CHK1, MYT1, FANCM and BRIP1, or a pool of all four duplexes. At 48 hours post siRNA transfection, WiDr cells were exposed to 150, 300 or 600 nM MK-1775 for 4 days. Log2 fold change in cell viability is shown for each siRNA relative to siCON1. D. Western blot analysis of cell lysates harvested 72 hours after transfection with siRNAs targeting CHK1, MYT1 and BRIP1. β-Actin was used as loading control. For FANCM, cDNA was prepared from RNA isolated 48 hours after siRNA transfection. FANCM mRNA expression was normalised to GUSB mRNA expression. Error bars represent SEM of three technical replicates. E. Effect of CHK1, MYT1, FANCM (FM) and BRIP1 siRNAs and siCON1 (non-targeting control) on sensitivity to MK-1775 in breast cell lines CAL120, MCF7, SKBR3 and SUM44. Cell viability (normalised to siCON1-transfected cells without MK-1775) is shown after exposure to 300 or 600 nM MK-1775 for 4 days as determined by CellTiter-Glo. Numbers below the graph indicate cell viability after 300 nM MK-1775 relative to no drug treatment for each siRNA separately. Error bars represent SEM of two independent experiments.
Figure 2
Figure 2. WEE1 inhibition induces replication stress and premature mitosis A
Immunofluorescence of γH2AX (green) in WiDr cells treated with 250 nM MK-1775 for the indicated times. DNA was counterstained with DAPI (blue). Representative images and box and whisker plot of γH2AX intensity/cell are shown. Pan-nuclear γH2AX staining indicates widespread replication fork stalling. B. Time course of 53BP1 (red) and γH2AX (green) immunofluorescence after WEE1 inhibition (250 nM). Representative images and average number of 53BP1 foci per cell of two independent experiments are shown. C. Flow cytometry analysis of cells stained for γH2AX (left panel) and mitotic marker phospho-histone H3 (pH3; right panel) after treatment with 200 nM MK-1775 for the indicated times. Left panel illustrates two distinct populations of cells positive for γH2AX (green, in boxed area): γH2AXhigh and γH2AXlow; and a back-gated population of pH3-positive cells that is γH2AX-negative (in red). In the right panel, the γH2AXhigh and γH2AXlow cells are back-gated in a pH3 versus DNA content plot (pH3+ cells are gated in the boxed area). The γH2AXhighpH3+ double positive cells in these plots are premature mitotic (green cells in boxed area), while γH2AXlow cells were mainly in S or G2 phase (green cells outside boxed area). Normal mitotic cells positive for pH3 but not γH2AX are shown in red. D. Intracellular dTTP levels were determined in cell extracts from WiDr cells treated with MK-1775 for 2 hours (black bars) or 4 hours (grey bars). Data was normalised to untreated control cells. E. Nucleoside (nucl) supplementation reduced the number and intensity of γH2AX-positive cells after WEE1 inhibition. Representative immunofluorescence images and a box and whisker plot of γH2AX intensity/cell are shown of cells treated with 250 nM MK-1775 for 8 hours in the absence (white bars) or presence of nucleosides (grey bars). F. Quantification of mitotic (pH3+) and premature mitotic (γH2AXhighpH3+) cells by flow cytometry analysis. Cells were treated as described in C. nucl indicates supplementation with nucleosides. For γH2AXhighpH3+ cells, * denotes P<0.04 versus MK-1775 alone (ratio paired Student’s t-test).
Figure 3
Figure 3. WEE1 inhibition promotes unscheduled mitosis after CHK1 and MYT1 depletion A
Clonogenic survival of WiDr cells transfected with siCON1, siCHK1 or siMYT1, with colonies counted after 10 days of MK-1775 exposure. The number of colonies was normalised to untreated controls for each siRNA separately (clonogenic survival before normalisation in the absence of MK-1775: siCON1: 69%, siMYT1: 67% and siCHK1: 35%). Knockdown of CHK1 and MYT1 was confirmed by Western blot (β-Actin, loading control). B. Flow cytometry analysis of γH2AX and pH3 after transfection with siCON1, siCHK1 and siMYT1. Cells were exposed to 200 nM MK-1775 for the indicated times. γH2AXhighpH3+ cells represent unscheduled mitosis. Error bars represent SEM of two independent experiments. C. Immunofluorescence images showing induction of pan-nuclear γH2AX (green) and pH3 (red) staining in WiDr cells transfected with siCON1, siCHK1 or siMYT1 and exposed to 300 or 600 nM MK-1775 for 8 hours. Double γH2AX+pH3+ staining (yellow) indicates premature mitosis. DNA was counterstained with DAPI (blue). D. WiDr cells transfected with siCON1 (black bars) or siMYT1 (grey bars) were exposed to 250 nM MK-1775 for the indicated times. Cells were stained for γH2AX and imaged by confocal microscopy. Representative immunofluorescence images show premature mitotic cells (indicated by arrows) after 24 hours of MK-1775 exposure. Bar charts show number of γH2AX-positive cells (left), γH2AX intensity (middle) and premature mitosis (right) in siMYT1-transfected cells compared to siCON1. Error bars are SEM of two independent experiments.
Figure 4
Figure 4. WEE1 inhibition in FANCM- or BRIP1-depleted cells causes replication stress and unscheduled mitosis A
Immunofluorescence images showing induction of pan-nuclear γH2AX (green) and pH3 (red) staining in WiDr cells transfected with siCON1, siFANCM or siBRIP1 for 48 hours, and exposed to 250 nM MK-1775 for the indicated times. DNA was counterstained with DAPI (blue). Unscheduled mitosis is characterised by double γH2AX+pH3+ staining (yellow, quantified in Supplementary Fig. 4B). B. Representative flow cytometry plots measuring pH3 (mitosis) and γH2AX (in green; events were back-gated from γH2AX versus DNA content plots shown in Supplementary Fig. 4D) in cells transfected with siCON1, siFANCM and siBRIP1 and exposed to 250 nM MK-1775 for the indicated times. Normal mitotic pH3+ cells are shown in red. Arrows indicate premature mitotic cells that are γH2AXhighpH3+ double positive. A back-gated population of S-phase cells that is γH2AXlow is shown in green. 2N DNA content indicates cells in G1 phase, 4N DNA content indicates cells in either G2 or M phase. C. Quantification of mitosis (pH3+) and premature mitosis (γH2AXhighpH3+) by flow cytometry analysis of cells treated as described in B. For γH2AXhighpH3+ cells, * denotes P<0.05 versus siCON1 at 16h (ratio paired Student’s t-test). D. Western blots of FANCD2 in cells exposed to 300, 600 and 1000 nM of MK-1775 for 4 or 8 hours (left) or to 250 nM MK-1775 for indicated times (right). Hydroxyurea (HU) or mitomycin C (MMC) treatment for 24 hours served as positive controls. Ezrin and β-Tubulin were used as loading controls. S, short non-ubiquitinated FANCD2 isoform. L mono-ubiquitinated long isoform.
Figure 5
Figure 5. WEE1 inhibition in cells with FA defects results in nucleotide depletion and nucleoside supplementation defers the onset of replication stress A
WiDr cells were transfected with siCON1, siFANCM or siBRIP1, exposed to 250 nM MK-1775 for 4 hours, and processed for quantification of intracellular dTTPs. * denotes P=0.0015 for siFANCM and P=0.03 for siBRIP1 versus siCON1 + MK-1775 (paired Student’s t-test). B. 48 hours post transfection with siCON1, siFANCM (left panel) or siBRIP1 (right panel), WiDr cells were treated with MK-1775 for 4 days in the presence (open symbols) or absence of nucleosides (nucl; closed symbols). Cell viability was determined using CellTiter-Glo and normalised to untreated cells for each siRNA separately. Error bars represent SEM of two independent experiments. C. WiDr cells transfected with siCON1, siFANCM or siBRIP1 48 hours earlier were exposed to 250 nM MK-1775 for the indicated times in the absence (grey bars) or presence of nucleosides (blue bars). Cells were stained for γH2AX and imaged by confocal microscopy (representative images in Supplementary Fig. 5A). Box and whisker plots show representative quantification of γH2AX intensity/cell. D. Quantification of γH2AX-positive cells treated as described in C. Floating bar chart shows the minimum, maximum and mean values for the average γH2AX intensity/cell after MK-1775 treatment in the absence (grey bars) or presence of nucleosides (red bars) of at least two independent experiments. E. At 48 hours post transfection with siCON1, siFANCM or siBRIP1 in combination with siCON1 (black bars) or siMRE11 (grey bars), WiDr cells were exposed to 200, 250 or 300 nM MK-1775 for 4 days. Cell viability was determined using CellTiter-Glo and normalised to controls without MK-1775 for each siRNA combination separately. * denotes P<0.02; ns, not significant (ratio paired Student’s t-test). Knockdown of MRE11 was confirmed by Western blot analysis (β-Actin, loading control).

References

    1. Kastan MB, Bartek J. Cell-cycle checkpoints and cancer. Nature. 2004;432:316–23. - PubMed
    1. Aarts M, Linardopoulos S, Turner NC. Tumour selective targeting of cell cycle kinases for cancer treatment. Curr Opin Pharmacol. 2013;13:529–35. - PubMed
    1. Parker LL, Piwnica-Worms H. Inactivation of the p34cdc2-cyclin B complex by the human WEE1 tyrosine kinase. Science. 1992;257:1955–7. - PubMed
    1. Watanabe N, Broome M, Hunter T. Regulation of the human WEE1Hu CDK tyrosine 15-kinase during the cell cycle. EMBO J. 1995;14:1878–91. - PMC - PubMed
    1. Lindqvist A, Rodriguez-Bravo V, Medema RH. The decision to enter mitosis: feedback and redundancy in the mitotic entry network. J Cell Biol. 2009;185:193–202. - PMC - PubMed

Publication types

MeSH terms