. 2015 Feb 11;35(6):2530-46.
doi: 10.1523/JNEUROSCI.3933-14.2015.

Functional cooperation between the IP3 receptor and phospholipase C secures the high sensitivity to light of Drosophila photoreceptors in vivo

Affiliations

Functional cooperation between the IP3 receptor and phospholipase C secures the high sensitivity to light of Drosophila photoreceptors in vivo

Elkana Kohn et al. J Neurosci. .

Abstract

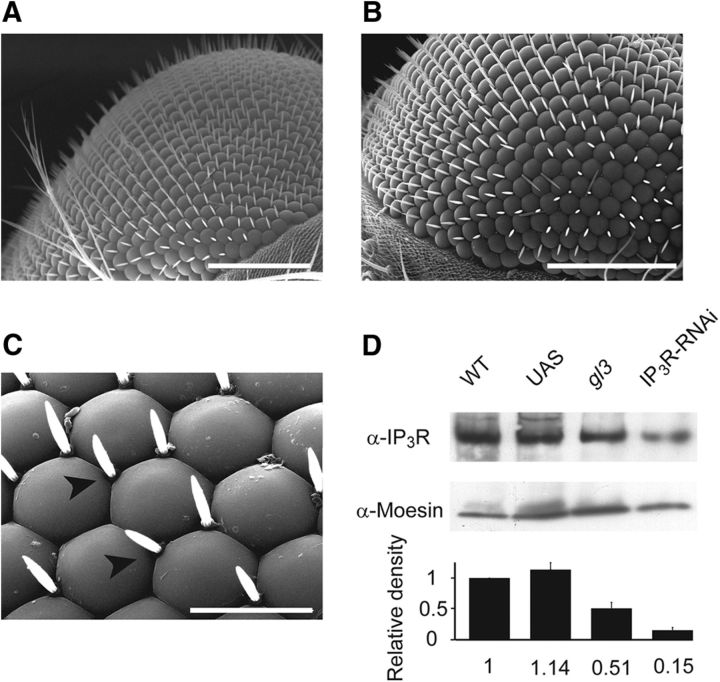
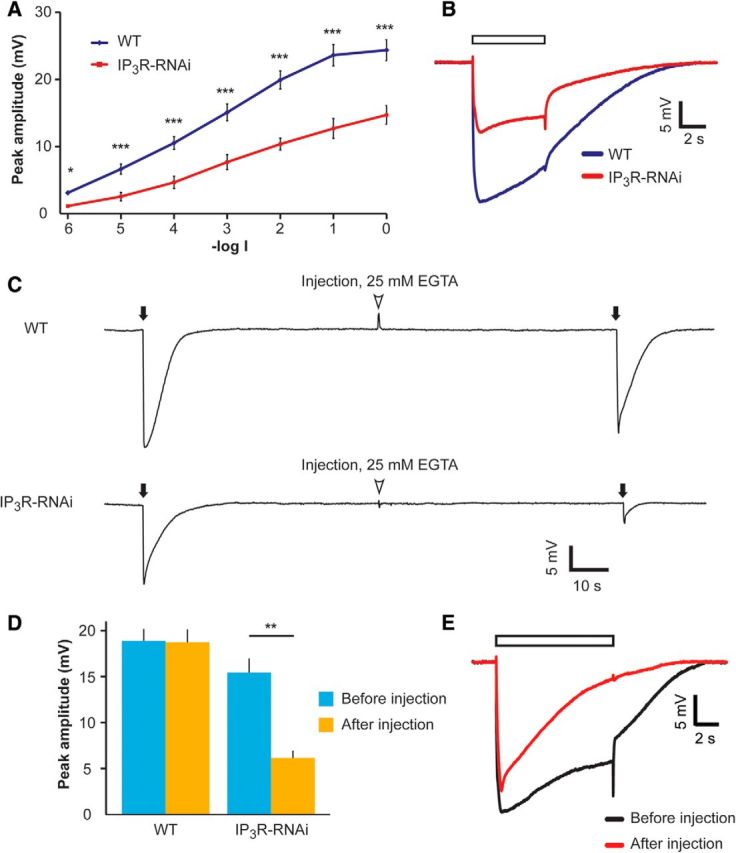
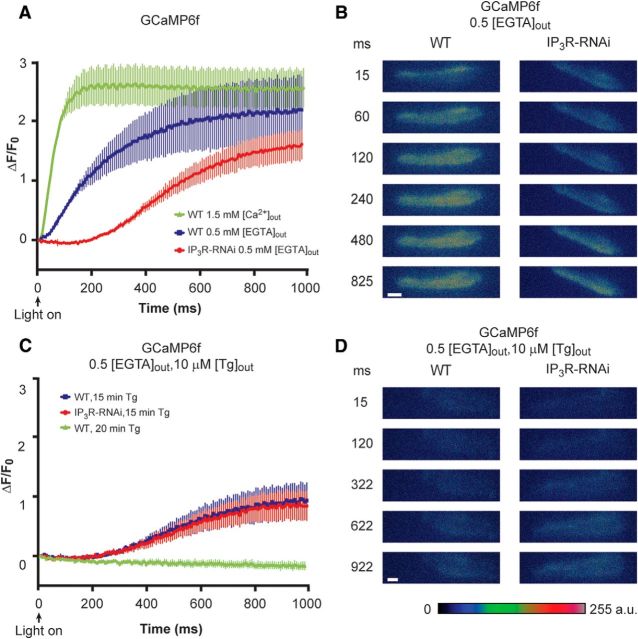
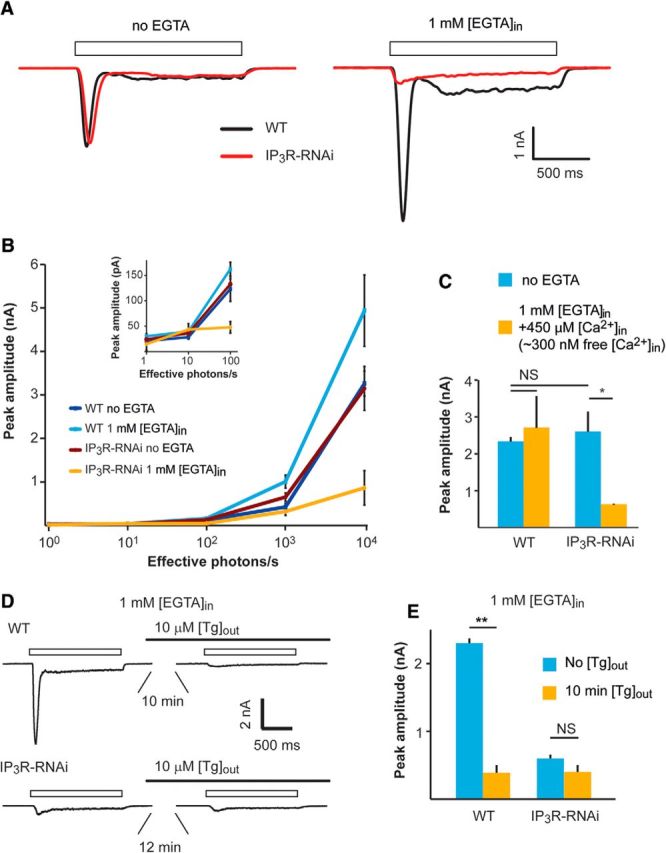
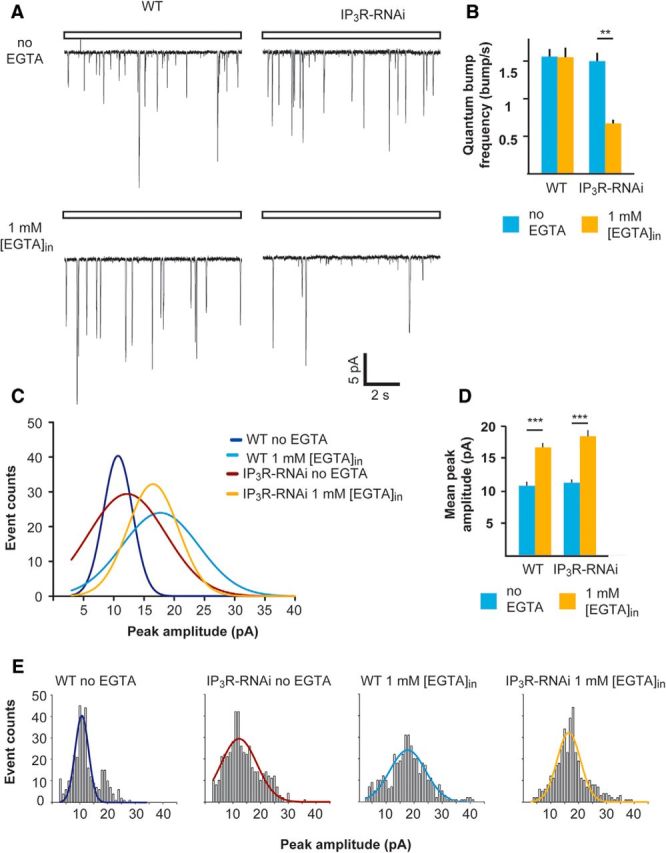
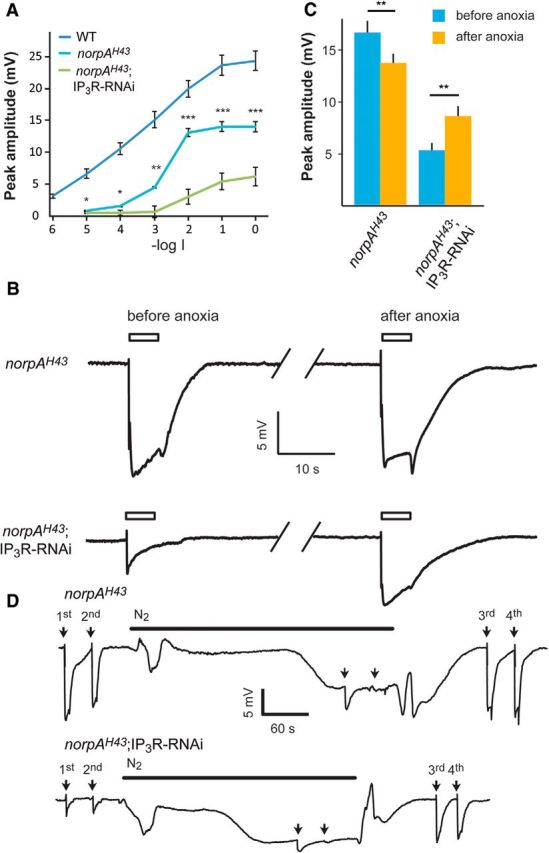
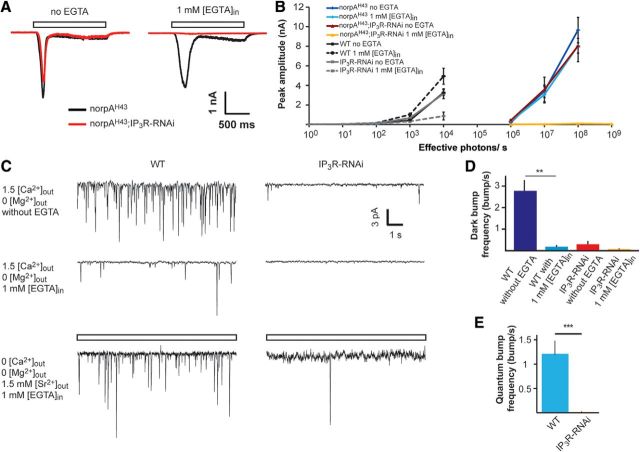
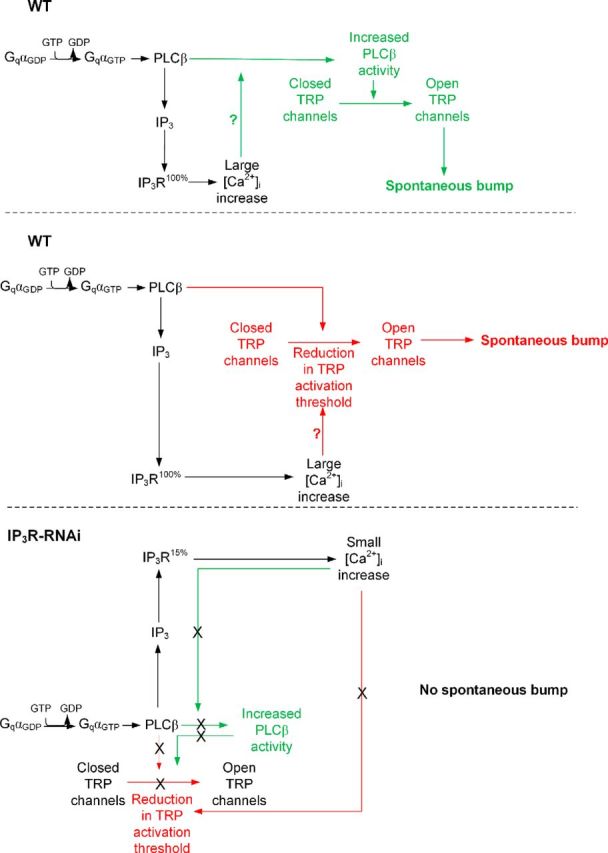
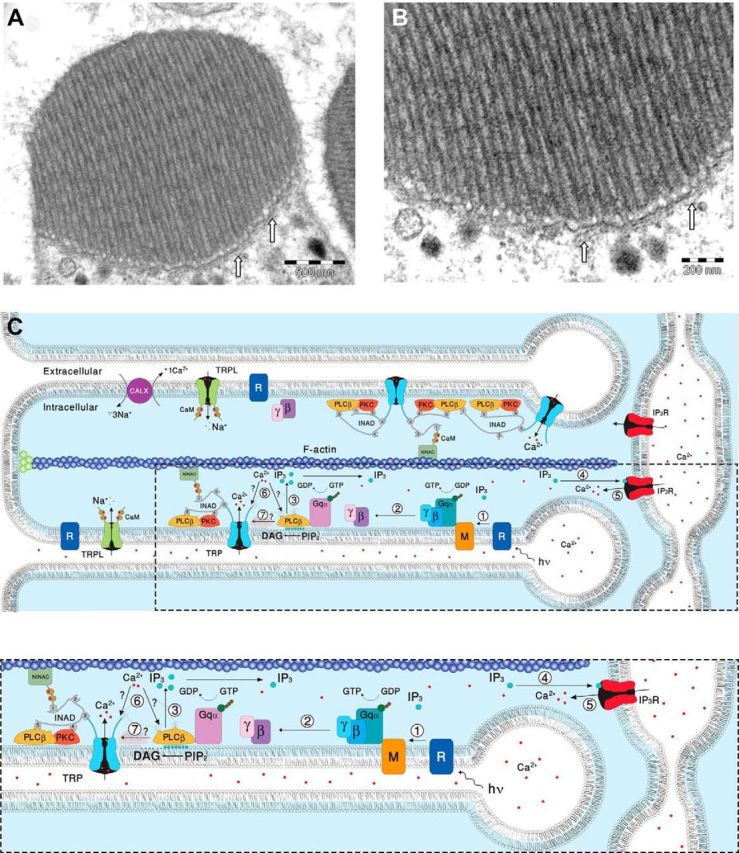
Drosophila phototransduction is a model system for the ubiquitous phosphoinositide signaling. In complete darkness, spontaneous unitary current events (dark bumps) are produced by spontaneous single Gqα activation, while single-photon responses (quantum bumps) arise from synchronous activation of several Gqα molecules. We have recently shown that most of the spontaneous single Gqα activations do not produce dark bumps, because of a critical phospholipase Cβ (PLCβ) activity level required for bump generation. Surpassing the threshold of channel activation depends on both PLCβ activity and cellular [Ca(2+)], which participates in light excitation via a still unclear mechanism. We show here that in IP3 receptor (IP3R)-deficient photoreceptors, both light-activated Ca(2+) release from internal stores and light sensitivity were strongly attenuated. This was further verified by Ca(2+) store depletion, linking Ca(2+) release to light excitation. In IP3R-deficient photoreceptors, dark bumps were virtually absent and the quantum-bump rate was reduced, indicating that Ca(2+) release from internal stores is necessary to reach the critical level of PLCβ catalytic activity and the cellular [Ca(2+)] required for excitation. Combination of IP3R knockdown with reduced PLCβ catalytic activity resulted in highly suppressed light responses that were partially rescued by cellular Ca(2+) elevation, showing a functional cooperation between IP3R and PLCβ via released Ca(2+). These findings suggest that in contrast to the current dogma that Ca(2+) release via IP3R does not participate in light excitation, we show that released Ca(2+) plays a critical role in light excitation. The positive feedback between PLCβ and IP3R found here may represent a common feature of the inositol-lipid signaling.

Keywords: Ca2+ release; Drosophila; IP3 receptor; phospholipase C; photoreceptors; phototransduction.


Figures

Figure 1.
Figure 1.
IP3R-RNAi retinae show virtually normal eye morphology but reduced IP3R expression levels. A–C, SEM comparing eye of IP3R-RNAi (B, C) and WT flies (A). Scale bars: A, B, 100 μm; C, 20 μm. Arrowheads point to corneal hairs. D, Western blot analysis of isolated retinae (20–30 retinae for each lane) of IP3R-RNAi fly using α-IP3R. The expression levels of IP3R in IP3R-RNAi retinae are compared with its expression levels in isolated retinae of WT, P[UAS:IP3R-RNAi] (UAS), and gl3 mutant (lacking the photoreceptor cells). Relative protein amounts were quantified from band intensities. The density of each lane was divided by the density of α-Moesin (middle row) and calculated as a percentage of WT flies for each experimental run. Bottom, A histogram presenting the average of three independent experiments (mean ± SEM, n = 3); no significant difference was found between WT and UAS, (t test, p = 0.140), but a significant difference was found between WT and gl3 (t test, p = 0.037) and between WT and IP3R-RNAi (t test, p = 0.0029).
Figure 2.
Figure 2.
IP3R-RNAi flies show reduced ERG response to light, which was further reduced at low external Ca2+, in vivo. A, Intensity–response (V-logI) curve of peak ERG response amplitudes. The different curves were measured from WT and IP3R-RNAi flies in response to 5 s lights (mean ± SEM, t test, *p < 0.05, ***p < 0.001; n = 10). B, Representative ERG traces in response to a light pulse applied to IP3R-RNAi and WT flies. ERG traces used in A at -log1 light intensity. The open box is the light monitor. C, Reduced ERG amplitude in response to light flash at low extracellular Ca2+. Top, Responses to brief saturated flashes (filled arrows) before and after pressure injection of EGTA-containing solution (arrowheads). Bottom, The same experimental paradigm was repeated in the IP3R-RNAi fly. D, A histogram summarizing the experiments presented in C. A comparison of the response to light flash between WT and IP3R-RNAi (mean ± SEM, t test, p = 0.470 and p = 0.0016 before and after EGTA injection, respectively; n = 10). E, Superimposed ERG traces from a WT fly in response to prolonged light pulse (used in A and B) before (black) and after (red) EGTA injection.
Figure 3.
Figure 3.
Reduced light-induced intracellular Ca2+ elevation in intact photoreceptors of IP3R-RNAi flies as measured by GCaMP6f fluorescence. A, Measurements of GCaMP6f fluorescence revealing the kinetics of light-induced increase in cytosolic [Ca2+]. The ordinate plots ΔF/F0 (see Materials and Methods) as a function of time in GCaMP6f flies on WT background at 1.5 mm external [Ca2+] (green) and at 0 (0.5 mm [EGTA]) external [Ca2+] (blue) and in GCaMP6f flies on IP3R-RNAi background at 0 (0.5 mm [EGTA]) external [Ca2+] (red). The plotted curves are means ± SEM. To quantify the difference between the blue and red curves, we compared the difference in fluorescence intensity at 60 and 300 ms of the blue and red curves and found that IP3R-RNAi flies expressing GCaMP6f at 0 extracellular Ca2+ (red) revealed a significant smaller increase of Ca2+ elevation in IP3R-RNAi flies relative to WT flies (t test, p = 0.0098, p = 0.0084 at 60 and 300 ms after light onset, respectively; n = 10). Because of the high affinity of GCaMP6f to Ca2+ (Kd of ∼170 nm) and the large Ca2+ influx at 1.5 mm [Ca2+]out, the Ca2+ indicator reached saturation at the time of maximal fluorescence and only the initial rise of the curves should be considered. B, A time series of whole ommatidia images of control (WT background at 0 external Ca2+) and IP3R-RNAi ommatidia, showing the fluorescence of the GCaMP6f during light stimulation. Scale bar, 10 μm. C, No difference was found between Ca2+ released from internal stores of control and IP3R-RNAi after store depletion by Tg. Measurements of GCaMP6f fluorescence at 0 external Ca2+ (0.5 mm [EGTA]) following 15 min of prior incubation in standard extracellular solution (1.5 mm [Ca2+]) including 10 μΜ Tg in WT (blue) and in IP3R-RNAi backgrounds (red). Incubation of >20 min with Tg of ommatidia from GCaMP6f on WT background flies abolished the increase in fluorescence (green). Tg was also included in the 0 external Ca2+ solution during the fluorescent measurement (n = 10). D, A time series of ommatidia images of control and IP3R-RNAi at the conditions of C, showing the fluorescence of the GCaMP6f during light stimulation. Scale bar, 10 μm.
Figure 4.
Figure 4.
A–C, Patch-clamp whole-cell recordings showing reduced responses to light of IP3R-RNAi photoreceptors when Ca2+ is buffered by EGTA in the pipette solution. A, Representative traces from whole-cell patch-clamp recordings with and without 1 mm [EGTA] added to the pipette solution. Open boxes represent the duration of light pulses. B, Intensity–response relationship of WT and IP3R-RNAi with and without 1 mm EGTA added into the pipette solution as indicated. Inset, The initial graph of B at higher magnification. C, A histogram comparing light responses to a constant light intensity of WT and IP3R-RNAi photoreceptors with standard intracellular solution and when the solution contained ∼300 nm free Ca2+ (mean ± SEM, t test, p = 0.045; n = 5). D, E, Functional Ca2+ pump at the internal Ca2+ stores is required for normal light response while Ca2+ pump inhibition by Tg mimicked the phenotype of IP3R-RNAi phenotype. D, Representative whole-cell recordings of current traces obtained from WT (top) and IP3R-RNAi photoreceptors (bottom), before and after prior incubation (10 min) of the cells in standard bath solution (1.5 mm [Ca2+]) containing 10 μm [Tg]. Solid and open bars represent the time of Tg application and the light monitor, respectively. E, Histograms comparing the peak amplitude of the light-induced current of WT and IP3R-RNAi photoreceptors before and after 10 min of incubation with Tg (mean ± SEM, t test, p = 0.0015; n = 5).
Figure 5.
Figure 5.
The frequency but not amplitude of single-photon responses was reduced significantly in IP3R-RNAi flies compared with WT flies when the pipette solution was buffered with EGTA. A, Representative traces of unitary current responses to single photons (quantum bumps) of WT and IP3R-RNAi ommatidia recorded with standard pipette solution (top) or with 1 mm [EGTA] added (bottom). B, A histogram comparing the quantum-bump frequency of WT and IP3R-RNAi photoreceptors with or without EGTA in the recording pipette (mean ± SEM, t test, p = 0.0058; n > 300 bumps for each column, n = 4). C, Distributions of quantum-bump amplitudes. The Gaussians that fit the histograms of quantum-bump amplitude distribution in E (n > 300 for each histogram, with and without EGTA in the pipette solution). D, A histogram comparing the mean quantum-bump amplitudes of WT and IP3R-RNAi with or without EGTA in the recording pipette (mean ± SEM, t test, p = 0.00038, p = 0.00078, for WT and IP3R-RNAi flies, respectively) as derived from bump-amplitude distributions of E. E, Histograms of bump-amplitude distribution with the fitted Gaussians presented in C.
Figure 6.
Figure 6.
Ca2+ is a limiting factor, which determines the maximal ERG amplitude when reduced IP3R levels were combined with reduced catalytic activity of PLCβ. A, Intensity–response relationship of peak ERG responses to increasing intensities of light stimulations of WT (redrawn from Fig. 2), norpAH43, and norpAH43;IP3R-RNAi flies. B, Traces of ERG recordings of norpAH43 and norpAH43;IP3R-RNAi in response to maximal intensity light pulses (open bar) before and after application of anoxia (see D below), which is known to robustly increase cellular Ca2+. C, A histogram comparing the peak amplitude of the ERG light responses of norpAH43 and norpAH43;IP3R-RNAi before and after anoxia (mean ± SEM, t test, p = 0.0014 and p = 0.00035 for norpAH43 and norpAH43;IP3R-RNAi, respectively; n = 10). D, Traces showing the entire experiments from which the ERG traces of B were taken. Traces of prolonged ERG recordings of norpAH43 (top trace) and norpAH43;IP3R-RNAi (bottom trace) in response to maximal intensity light pulses (arrows) followed by N2 application. Anoxia was obtained by blowing N2 on the intact fly as indicated by the horizontal line. The additional light pulses (3rd and 4th), tested the effects of cellular Ca2+ elevation by the anoxia on the ERG. The amplitudes of the ERG responses to the first and the third light pulses in each trace should be compared. The light pulses applied during anoxia (2 unmarked arrows) induced only very small light responses because most TRP and TRPL channels were already open by the anoxia.
Figure 7.
Figure 7.
Synergistic effect on the response to light between reduced IP3R level and reduced catalytic activity of PLCβ as revealed by whole-cell recordings. A, Representative traces showing whole-cell patch-clamp recordings from norpAH43 (black) and norpAH43;IP3R-RNAi (red) with and without 1 mm [EGTA] added into the standard pipette solution. B, Intensity–response relationship of norpAH43 (redrawn from Fig. 4) and norpAH43;IP3R-RNAi with and without EGTA added into the pipette as indicated. C, D, Dark-bump production was virtually abolished in IP3R-RNAi photoreceptors (C, top and middle left traces). Representative traces showing dark bumps of WT fly recorded for 1 min at 1.5 mm external [Ca2+] while Mg2+ was omitted from the bath solution. The dark bumps were recorded without (top) or with 1 mm [EGTA] (middle) in the pipette solution. The paradigm of the left traces was repeated in IP3R-RNAi fly (C, top and middle right traces). D, A histogram presenting dark-bump frequency during 1 min recordings in WT and IP3R-RNAi photoreceptors at the conditions of C (mean ± SEM, t test, p = 0.00598, n = 5; C, bottom line and E). Quantum-bump production of IP3R-RNAi photoreceptors was virtually abolished when extracellular Ca2+ was replaced by Sr2+ and Ca2+ was buffered in the intracellular pipette solution (C, bottom left). Traces showing quantum bumps of WT in response to dim light of 1.5 effective photons/s (open box) recorded for 1 min when extracellular Ca2+ was replaced by 1.5 mm [Sr2+]out, Mg2+ was omitted from the bath solution, and 1 mm [EGTA] was included in the pipette solution. Bottom right, The paradigm of the bottom left trace was repeated in IP3R-RNAi fly. E, A histogram presenting quantum-bump frequency during 1 min recordings in WT and IP3R-RNAi photoreceptors when extracellular Ca2+ was replaced by Sr2+ (mean ± SEM, t test, p = 0.00013; n = 5).
Figure 8.
Figure 8.
A model explaining the mechanism of spontaneous bump generation and the effect of reduced IP3R level and Ca2+ release on spontaneous bump generation (see Discussion).
Figure 9.
Figure 9.
EM pictures and a diagram showing structural features of the signaling compartment and the localization of the signaling molecules. Top, TEM showing the microvilli composing dark-adapted WT rhabdomere. A, TEM of a cross section of a rhabdomere, which is composed of tightly packed microvilli. The elongated membrane vesicles virtually touching the base of the microvilli (arrows) are extensions of the smooth ER called SMC and constitute the IP3-sensitive Ca2+ stores. B, Higher magnification of the rhabdomere at the base of the microvilli, showing the SMC (arrows). C, A diagram showing the molecular components of the signal transduction cascade of Drosophila:,1, Upon absorption of a photon (hν), rhodopsin (R) is converted into metarhodopsin (M). 2, The R-to-M photoconversion leads to the activation of heterotrimeric G-protein(Gqα,β,γ) by promoting the GDP-to-GTP exchange. 3, The GDP-to-GTP exchange in turn leads to activation of PLCβ, which hydrolyzes PIP2 into the soluble IP3 and the membrane-bound DAG. 4, Subsequently, IP3 molecules (blue dots) diffuse along the microvillus and bind to the IP3 receptor (IP3R) located at the SMC. 5, Binding of IP3 to the IP3R causes release of Ca2+ (red dots) from the SMC and its diffusion back into the microvillus followed by binding of Ca2+ to both PLCβ and the TRP channel. 6, This binding either facilitates the catalytic activity of PLCβ (?) or reduces the threshold of TRP channel activation (?, see Fig. 8). 7, Two classes of light-sensitive channels, the TRP and TRPL, open by a still unknown mechanism (?) following PLCβ activation. The TRP and TRPL channel openings lead to elevation of cellular Ca2+. Elevation of DAG and Ca2+ promote eye-specific PKC activity, which regulates channel activity. PLCβ, PKC, and the TRP ion channel form a supramolecular complex with the scaffolding protein INAD, which is bound to the F-actin cytoskeleton via the NINAC protein. Bottom, Magnification of the box marked by dotted lines in the top diagram.

Similar articles

Cited by

References

    1. Abramoff MD, Magelhaes PJ, Ram SJ. Image processing with ImageJ. Biophotonics Int. 2004;11:36–42.
    1. Acharya JK, Jalink K, Hardy RW, Hartenstein V, Zuker CS. InsP3 receptor is essential for growth and differentiation but not for vision in Drosophila. Neuron. 1997;18:881–887. doi: 10.1016/S0896-6273(00)80328-1. - DOI - PubMed
    1. Agam K, von Campenhausen M, Levy S, Ben-Ami HC, Cook B, Kirschfeld K, Minke B. Metabolic stress reversibly activates the Drosophila light-sensitive channels TRP and TRPL in vivo. J Neurosci. 2000;20:5748–5755. - PMC - PubMed
    1. Agam K, Frechter S, Minke B. Activation of the Drosophila TRP and TRPL channels requires both Ca 2+ and protein dephosphorylation. Cell Calcium. 2004;35:87–105. doi: 10.1016/j.ceca.2003.08.001. - DOI - PubMed
    1. Allbritton NL, Meyer T, Stryer L. Range of messenger action of calcium ion and inositol 1,4,5-trisphosphate. Science. 1992;258:1812–1815. doi: 10.1126/science.1465619. - DOI - PubMed

Publication types

MeSH terms

Substances

LinkOut - more resources