. 2015 Feb 11;35(6):2596-611.
doi: 10.1523/JNEUROSCI.2699-14.2015.

Control of axon guidance and neurotransmitter phenotype of dB1 hindbrain interneurons by Lim-HD code

Affiliations

Control of axon guidance and neurotransmitter phenotype of dB1 hindbrain interneurons by Lim-HD code

Ayelet Kohl et al. J Neurosci. .

Abstract

Hindbrain dorsal interneurons (HDIs) are implicated in receiving, processing, integrating, and transmitting sensory inputs from the periphery and spinal cord, including the vestibular, auditory, and proprioceptive systems. During development, multiple molecularly defined HDI types are set in columns along the dorsoventral axis, before migrating along well-defined trajectories to generate various brainstem nuclei. Major brainstem functions rely on the precise assembly of different interneuron groups and higher brain domains into common circuitries. Yet, knowledge regarding interneuron axonal patterns, synaptic targets, and the transcriptional control that govern their connectivity is sparse. The dB1 class of HDIs is formed in a district dorsomedial position along the hindbrain and gives rise to the inferior olive nuclei, dorsal cochlear nuclei, and vestibular nuclei. dB1 interneurons express various transcription factors (TFs): the pancreatic transcription factor 1a (Ptf1a), the homeobox TF-Lbx1 and the Lim-homeodomain (Lim-HD), and TF Lhx1 and Lhx5. To decipher the axonal and synaptic connectivity of dB1 cells, we have used advanced enhancer tools combined with conditional expression systems and the PiggyBac-mediated DNA transposition system in avian embryos. Multiple ipsilateral and contralateral axonal projections were identified ascending toward higher brain centers, where they formed synapses in the Purkinje cerebellar layer as well as at discrete midbrain auditory and vestibular centers. Decoding the mechanisms that instruct dB1 circuit formation revealed a fundamental role for Lim-HD proteins in regulating their axonal patterns, synaptic targets, and neurotransmitter choice. Together, this study provides new insights into the assembly and heterogeneity of HDIs connectivity and its establishment through the central action of Lim-HD governed programs.

Keywords: Lim-HD proteins; axons; hindbrain; interneurons; neurotransmitter; synapses.


Figures

Figure 1.
Figure 1.
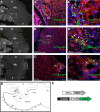
Labeling dB1 neuronal subgroup using Ptf1a enhancer element. A–F, Cross-section views of E3.5 hindbrains at the level of r4–r5 that were electroporated at E2.5 with Ptf1a::Cre plasmid, along with a conditional nGFP plasmid and immunostained with interneuronal markers. Ptf1a enhancer-derived nGFP+ neurons express Lhx1/5 (A) and Pax2 (B) yet are segregated from neurons expressing Lmx1b (C), Olig3 (D), Brn3a (E), and Pax6 (F). Higher-magnification views of the boxed areas in A–F are represented at the right panel in different channels. Arrowheads indicate the same GFP+ cell in all channels. Arrows indicate representative neurons that do not express GFP. G, H, Cross-section views of E7 hindbrains at the level of r7 that were electroporated at E2.5 at the level of r7–r8 with the Ptf1a::Cre plasmid along with a conditional nGFP plasmid (G) or with Pdx1::Cre and Ptf1a::FLP0 plasmids along with a dual-conditional GFP plasmid (H), and immunostained with the ION marker BEN. GFP+ neurons are seen in the ventral hindbrain and express BEN. Higher-magnification views of the boxed areas in G, H are represented at the right panel in different channels. Arrowheads indicate the same GFP+ cell in all channels. I, J, Flat-mounted and cross-section views of hindbrains that were electroporated at E2.5 with conditional alternating mCherry/GFP plasmid for testing the electroporation specificity. PTf1a-derived GFP expression is restricted to the location of dB1 (I, boxed area), whereas CAG derived mCherry-expressing neurons are widespread along the entire dorsovental axis. K–K″, Schematic representations of the plasmids used for labeling dB1 neurons. In all images, scale bars, interneuron subgroups, plasmids, and antibodies are indicated. FP, Floor plate; r, rhombomere.
Figure 2.
Figure 2.
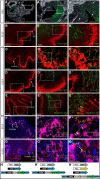
dB1 somas are located at auditory, vestibular, and ION hindbrain centers. A–C, Sagittal section views of brightfield and immunofluorescent E9.5 brainstems that were electroporated at E2.5 with Ptf1a enhancer-derived nGFP plasmid (E) to label dB1 neurons. nGFP+ neurons are located in the NA (A–A″, arrows), MVE (B–B″, arrows), and ION (C–C″, arrows). High-magnification views of the boxed areas in A–C′ are represented at the right panel of each image. D, Illustration of a brainstem sagittal section representing the AP positions of the nuclei centers demonstrated in A–C″. The illustration does not reflect the actual lateral–medial location of each nucleus. E, Schematic representations of the plasmids used for labeling dB1 neurons. In all images, scale bars, plasmids, and staining are indicated. Cb, Cerebellum; Cp, choroid plexus; Is, isthmus; Mb, midbrain; NA, nucleus angularis; NL, nucleus laminaris; NM, nucleus magnocellularis; r, rhombomere; A, anterior; P, posterior; Phallo, phalloidin.
Figure 3.
Figure 3.
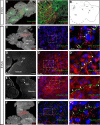
Axonal projections of dB1 neurons at E5–E7.5. A–D, Flat-mounted views of hindbrains that were electroporated at E2.5 with Ptf1a enhancer-derived mGFP plasmids (A–C) or with the constitutive PB conditional system (D). mGFP+ axonal projections are shown at E5–E7.5. High-magnification views of each of the axonal tracts are represented (A′–C″). A, At E5, dB1 axons extend longitudinally at the cMLF and cDF. B, At E6, an additional ipsilateral longitudinal fascicule is growing at the iMLF. C, At E7, two additional longitudinal tracts are evidenced at the iDF and iLF. D, At E7.5, the five tracts that are present at E7 are also labeled using the PB system. E, F, A schematic summary of dB1 axonal projections along the hindbrain at E5 and E7. G, H, Flat-mounted views of hindbrains that were electroporated at E2.5 at the level of r7–r8 with the Ptf1a-enhancer derived mGFP plasmids (G) or with Pdx1::Cre and Ptf1a::FLP0 plasmids along with a dual-conditional mGFP plasmid (H). An axonal tract extends longitudinally at the cDF. I–I″, Schematic representations of the plasmids used for labeling dB1 axons. In all images, white arrows indicate the cMLF, arrowheads indicate the cDF, dashed arrows indicate the iMLF, and asterisks indicate the iDF and iLF.
Figure 4.
Figure 4.
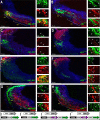
dB1 interneurons project to and synapse at Purkinje cerebellar layer. Sagittal section views of brightfield (A) and immunofluorescent (B–G) embryos electroporated at E2.5 with Ptf1a enhancer-derived myristolated GFP (mGFP) reporter (A–D), Pdx1+Ptf1a enhancer-derived mGFP reporter (E), or Ptf1a enhancer-derived synaptic (SV2-GFP) reporter (F, G) and the PB plasmids. dB1-derived GFP+ axons (A–E) and presynapses (F, G) are shown from E8.5-E15.5, following staining with cerebellar and presynaptic markers. A–A″, GFP+ axons ascend in the medulla and turn toward the cerebellar primordium at E8.5 (arrows). B, D″, GFP+ axons extend in the cerebellum and reach the Purkinje/Calb+ layer (C, arrow) but not the EGL/Ax-1+ domain (B, D, arrow) at E13.5-E15.5. E, ION-derived GFP+ axons reach the Purkinje/Calb+ layer (arrow). F–G″, SV-GFP+ presynapses are seen in the Purkinje/Calb+ layer at E13.5-E15.5. Colabeling of SV-GFP+/Syn-Tag+ synapses is evident (F″, G″, arrows). High-magnification views of the boxed areas in A–G′ are represented at the right panel of each image. Scale bars, plasmids, staining, and embryonic days are indicated. H–H″, A scheme representing the constructs used for labeling dB1 axons and presynapses. Cb, Cerebellum; Ax-1, axonin-1; Syn-Tag, synaptotagmin; Calb, calbindin.
Figure 5.
Figure 5.
dB1 interneurons form synaptic connections in auditory and vestibular nuclei. Sagittal section views of brightfield (A–F) and immunofluorescent (C′–F″) brainstems electroporated at E2.5 with Ptf1a enhancer-derived mGFP (A, A′) or synaptic (SV2-GFP) (C–F″) reporters and the PB plasmids. dB1-derived GFP+ axons (A–A′) and presynapses (C–F″) are shown at E13.5 and E15.5, following staining with presynaptic and midbrain markers. A, GFP+ axons are evident ascending beyond the midbrain-hindbrain border, marked by the En-1 (red). B, A schematic illustration of a brainstem sagittal section representing the AP and DV positions of the auditory and vestibular nuclei in the midbrain. The nuclei positions do not reflect the actual lateral–medial locations of each nuclei. C–E″, SV2-GFP+ presynapses are found in the dorsal midbrain (C–C″), at the EW (D–D″, arrowheads) and MLD (E–E″, arrowhead). C″, Arrows indicate SV2-GFP-labeled synapses coexpressing the synaptic marker Syn-Tag. F–F″, SV-GFP+ presynapses are found in the dorsal medulla. F″, Arrows indicate SV2-GFP-labeled synapses coexpressing the synaptic marker Syn-Tag. In all images, higher-magnification views of the boxed areas in the left panels are presented at their respective right panels. Scale bars, plasmids, staining, and embryonic days are indicated. Cb, Cerebellum; MB, midbrain; Syn-Tag, synaptotagmin; Phallo, phalloidin; EW, Edinger–Westphal; MG, medial geniculate nucleus; DLA, dorsolateralis anterior nucleus; r, rhombomere.
Figure 6.
Figure 6.
Alterations in dB1 axonal projection by modification of the Lim-HD code. A–H, Cross sections of E3.5 hindbrains that were electroporated at E2.5 with Ptf1a enhancer-derived ectopic Lhx2 (dB1Lhx2; A, C, E, G) or Lhx9 (dB1Lhx9; B, D, F, H) plasmids. Sections were stained with different interneuron markers. The ectopic expression of Lhx2/9 is accompanied with expression of taumyc (I). A, B, Ectopic expression of Lhx2 (A) or Lhx9 (B) in dB1/taumyc+ neurons. C, H, Ectopic expression of Lhx2 (C, E, G) or Lhx9 (D, F, H) in dB1 neurons downregulates expression of Lhx1/5 (C, D) and Pax2 (G, H) but does not activate expression of Olig3 (E, F). A–H, Boxed areas are represented in their different channels in magnified views to the right of each panel. Arrowheads indicate representative neurons that coexpress taumyc and the examined interneuron marker. Arrows indicate representative neurons that do not express taumyc. I, A schematic representation of the plasmids used for ectopic expression of Lhx2 or Lhx9 in dB1 neurons. J–L, Flat-mounted views of E5 hindbrains coelectroporated at E2.5 with Ptf1a::Cre-derived mCherry (J, red) and EdI1::Flp-derived GFP (K, green) plasmids (Q). J, K, Axonal patterns of dB1 and dA1 are shown. L, A merged image demonstrating the distinct axonal patterns of dB1 or dA1 subgroups. Arrowheads and arrows indicate cDF and cMLF, respectively. Dashed arrow and asterisks indicate cLF and cDF, respectively. M, O, Flat-mounted views of E4.5 hindbrains that were electroporated at E2.5 with Ptf1a enhancer-derived ectopic Lhx2 (Ptf1aLhx2; M) or Lhx9 (Ptf1aLhx9; O)-taumyc expression plasmids (I). Alerted dB1 axonal trajectories are shown. N, P, Flat-mounted hindbrains of E4.5 embryos coelectroporated at E2.5 with Ptf1a enhancer-derived ectopic Lhx2 (N) or Lhx9 (P)-taumyc expression plasmids in dB1 neurons (red) and EdI1::Flp-derived-GFP expression plasmid in dA1 neurons (green). Colocalization of Ptf1aLhx2/9 and dA1 is shown. M–P, Boxed areas represent higher-magnification views in M′–P′, respectively. Arrows and arrowheads indicate cDF and cLF, respectively. Dashed arrows indicate iLF. Q, A schematic illustration of the plasmids used in J–P. In all images, plasmids, antibodies, and scale bars are indicated.
Figure 7.
Figure 7.
Alterations in dA1 and dB1 neurotransmitter profile by modification of the Lim-HD code. A–H, Cross-section views of E3.5 hindbrains at the level of r4-r5 that were electroporated at E2.5 with Ptf1a::Cre-derived GFP plasmid (A, C), Ptf1a::Cre-derived ectopic Lhx2-taumyc plasmid (B, D), EdI1:Cre-derived GFP plasmid (E, G), and EdI1:Cre-derived ectopic Lhx1-taumyc plasmid (F, H). Sections were stained with GABA and VGlut2 antibodies. Higher-magnification views of the boxed areas in A–H are represented at the right panels in different channels. Arrowheads indicate representative axons that coexpress GFP/taumyc and the neurotransmitter. Arrows indicate representative neurons that do not express GFP/taumyc. A, B, Intact dB1-GFP+ neurons express GABA, whereas dB1Lhx2-taumyc+ neurons downregulate GABA. C, D, Intact dB1-GFP+ neurons do not express VGlut2, whereas part of dB1Lhx2-taumyc+ neurons upregulate VGlut2. E, F, Intact dA1-GFP+ neurons express VGlut2, whereas dA1Lhx1-taumyc+ neurons downregulate vGlut2. G, H, dA1-GFP+ neurons and dA1Lhx1-taumyc+ neurons do not express GABA. In all images, scale bars, plasmids, antibodies, and interneuron subgroups are indicated. I–I‴, Schematic representation of plasmids used for labeling intact dB1 (Ptf1a::Cre) and dA1 (EdI1::Cre) neurons (A, C, E, G). Schematic representation of plasmids used for ectopic expression of Lim-HD transcription factors, Lhx2 in dB1 (Ptf1a::Cre) neurons, and Lhx1 in dA1 (EdI1::Cre) neurons (B, D, F, H).
Figure 8.
Figure 8.
Alteration in dB1 synaptic targets by modification of the Lim-code. A–C, Sagittal section views of E14 cerebellums from embryos electroporated at E2.5 with a combination of Ptf1a::Phic31o, Phic31o-conditional Lhx2-Cre, Cre-conditional SV2-GFP, and the PBase plasmids. Sections were stained with cerebellar (Zic1, Calb) and presynaptic (Syn-Tag) markers. dB1Lhx2-derived SV2-GFP+ synapses are evident in the EGL (A–A″), Purkinje (B–B″), and IGL (C–C″). Higher-magnification views of the boxed areas in each panel are presented at their respective right panel. Arrowheads indicate SV2-GFP+ synapses. Arrows indicate SV2-GFP+/Syn-Tag+ synapses. In all images, scale bars, plasmids, and antibodies are indicated. D–D′, Schematic representation of plasmids used for transient expression of Lhx2 and constitutive expression of SV2-GFP in dB1 neurons (D) or Lhx1 and SV2-GFP in dA1 neurons (D′). E, Quantification of the number of SV2-GFP+ synapses derived from normal and Lim-code modifies dA1 and dB1 neurons at different cerebellar layers. F, A model illustrating the distinct roles of the Lim-code in conferring dA1 and dB1 circuit formation. Left panel, Typical axonal patterns, neurotransmitter phenotype, and cerebellar synaptic targets of dA1 (red) and dB1 (yellow) interneurons. Middle panel, dA1Lhx1 neurons that switched their axonal patterns into dB1-like routes, downregulated VGlut expression, but retained their synaptic targets at the EGL, IGL, and Purkinje layers. Right panel, dB1Lhx2 neurons that switched their axonal projections, neurotransmitter phenotype, and cerebellar synaptic targets into dA1-like interneurons. Syn-Tag, synaptotagmin; Calb, calbindin.

Similar articles

Cited by

References

    1. Akert K, Glicksman MA, Lang W, Grob P, Huber A. The Edinger–Westphal nucleus in the monkey: a retrograde tracer study. Brain Res. 1980;184:491–498. doi: 10.1016/0006-8993(80)90816-1. - DOI - PubMed
    1. Alsina B, Vu T, Cohen-Cory S. Visualizing synapse formation in arborizing optic axons in vivo: dynamics and modulation by BDNF. Nat Neurosci. 2001;4:1093–1101. doi: 10.1038/nn735. - DOI - PubMed
    1. Altman J, Bayer SA. Time of origin and distribution of a new cell type in the rat cerebellar cortex. Exp Brain Res. 1977;29:265–274. - PubMed
    1. Altman J, Bayer SA. Development of the brain stem in the rat: III. Thymidine-radiographic study of the time of origin of neurons of the vestibular and auditory nuclei of the upper medulla. J Comp Neurol. 1980;194:877–904. doi: 10.1002/cne.901940410. - DOI - PubMed
    1. Avraham O, Hadas Y, Vald L, Zisman S, Schejter A, Visel A, Klar A. Transcriptional control of axonal guidance and sorting in dorsal interneurons by the Lim-HD proteins Lhx9 and Lhx1. Neural Dev. 2009;4:21. doi: 10.1186/1749-8104-4-21. - DOI - PMC - PubMed

Publication types