. 2015 Feb 11;35(6):2703-16.
doi: 10.1523/JNEUROSCI.3245-14.2015.

Basal ganglia outputs map instantaneous position coordinates during behavior

Affiliations

Basal ganglia outputs map instantaneous position coordinates during behavior

Joseph W Barter et al. J Neurosci. .

Abstract

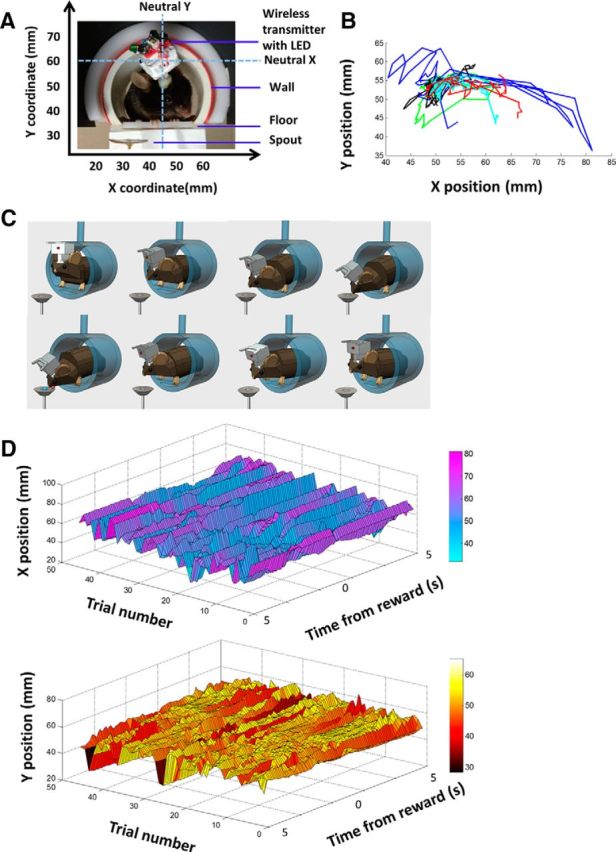
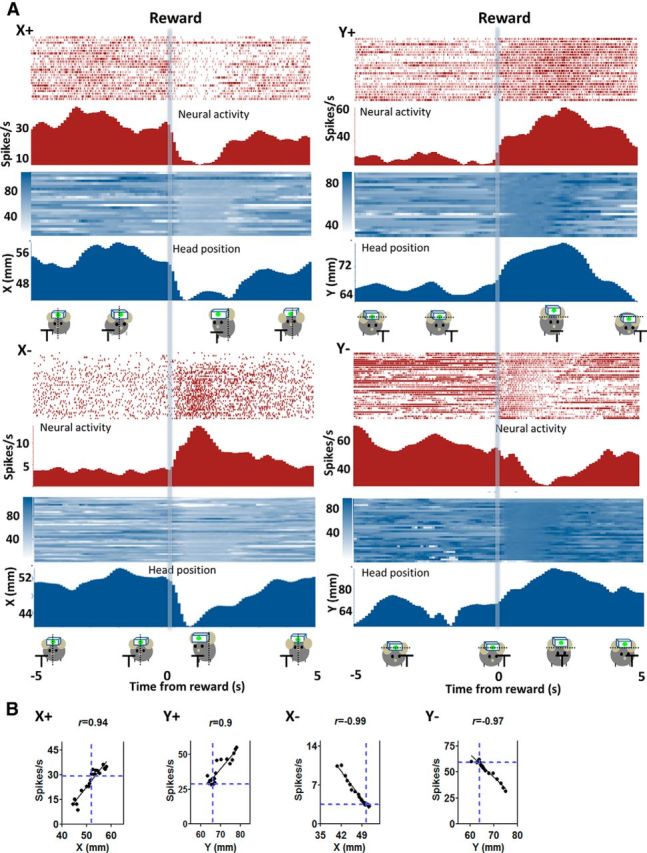
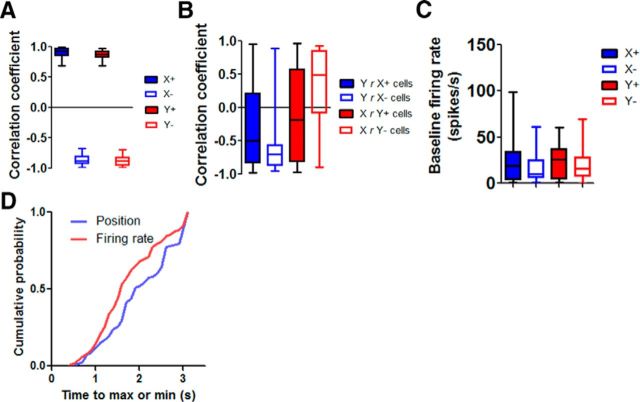
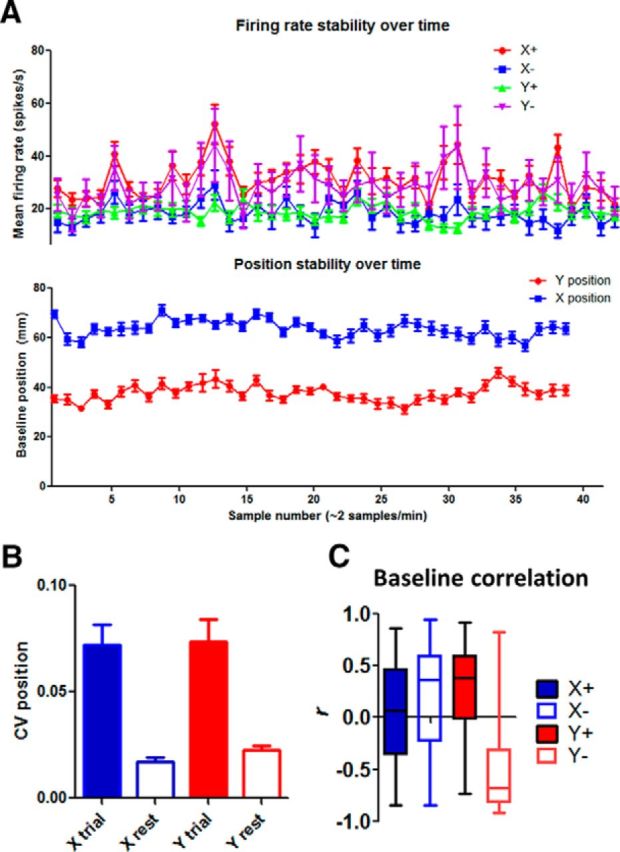
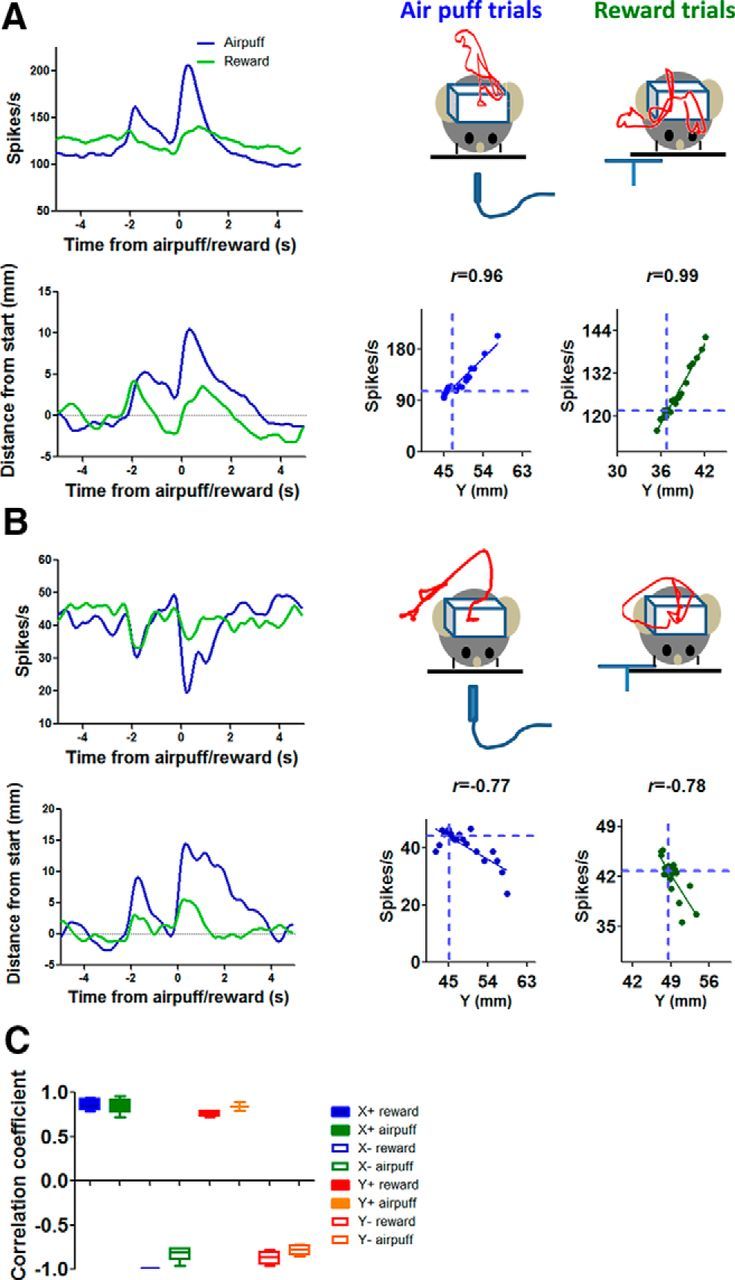
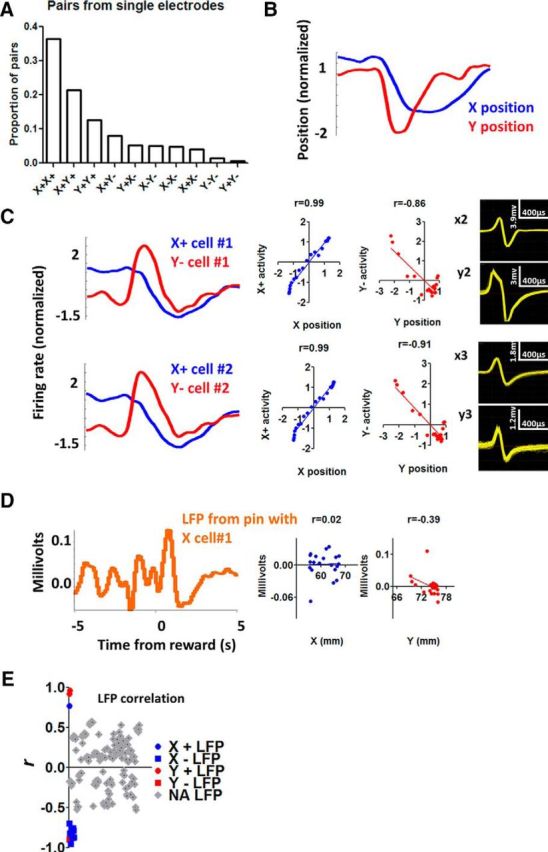
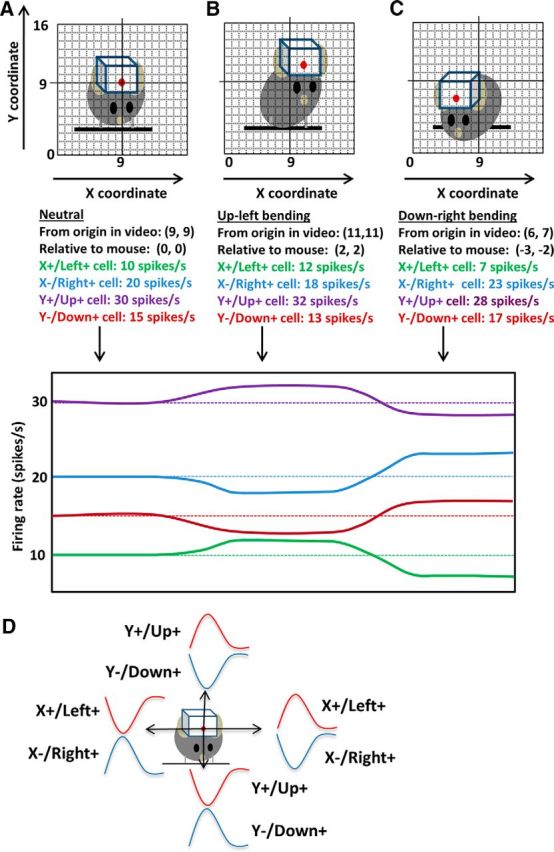
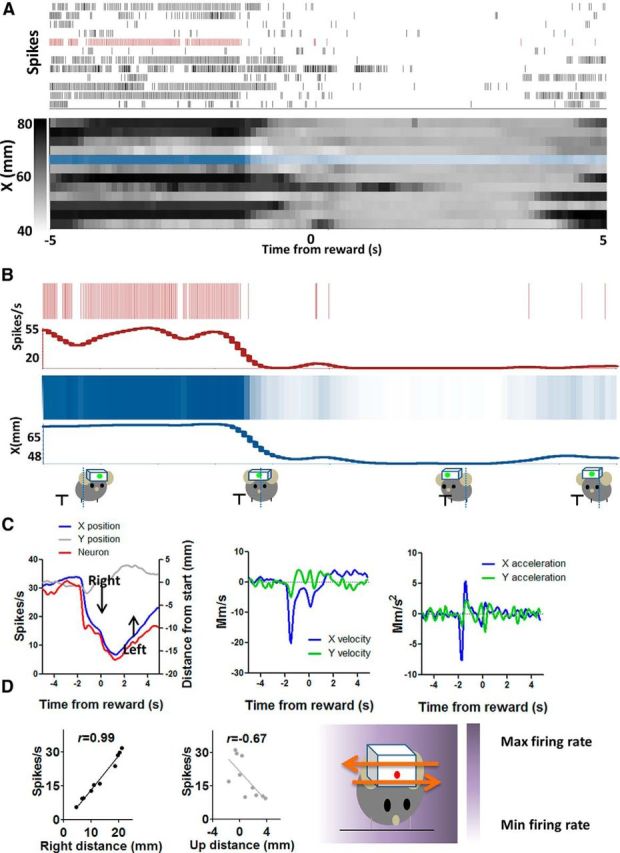
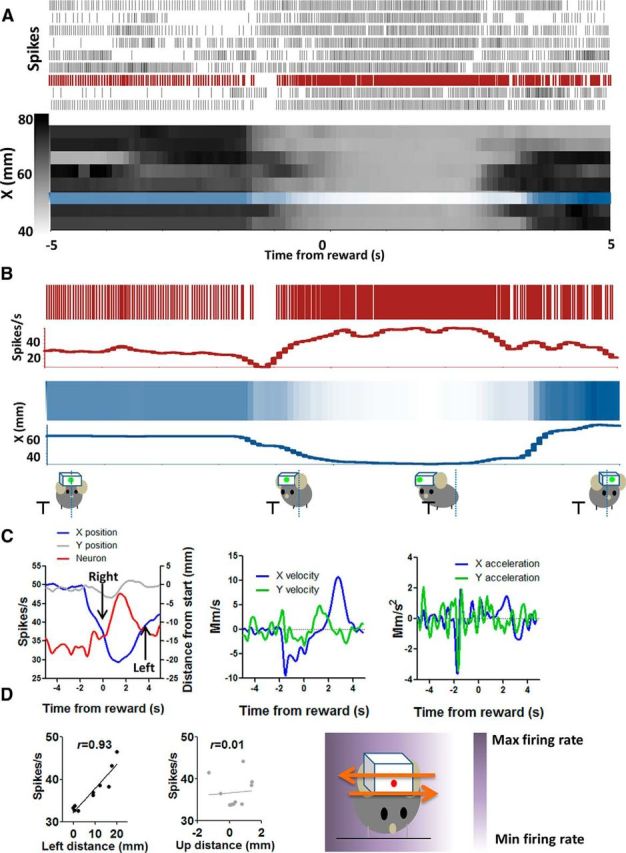
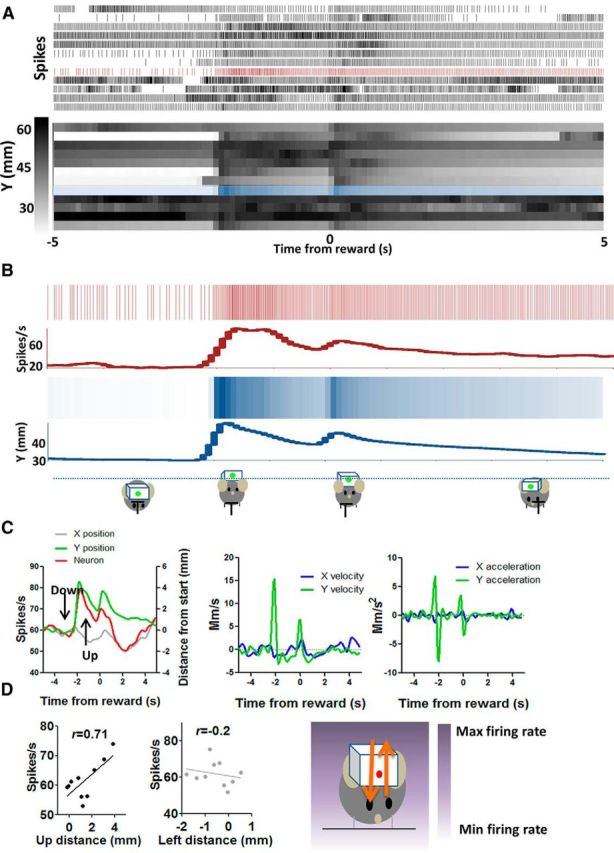
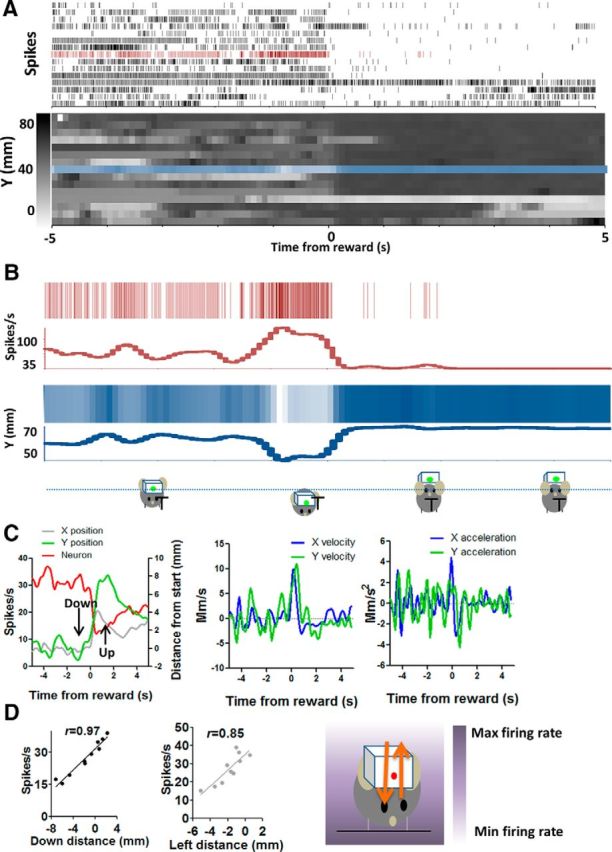
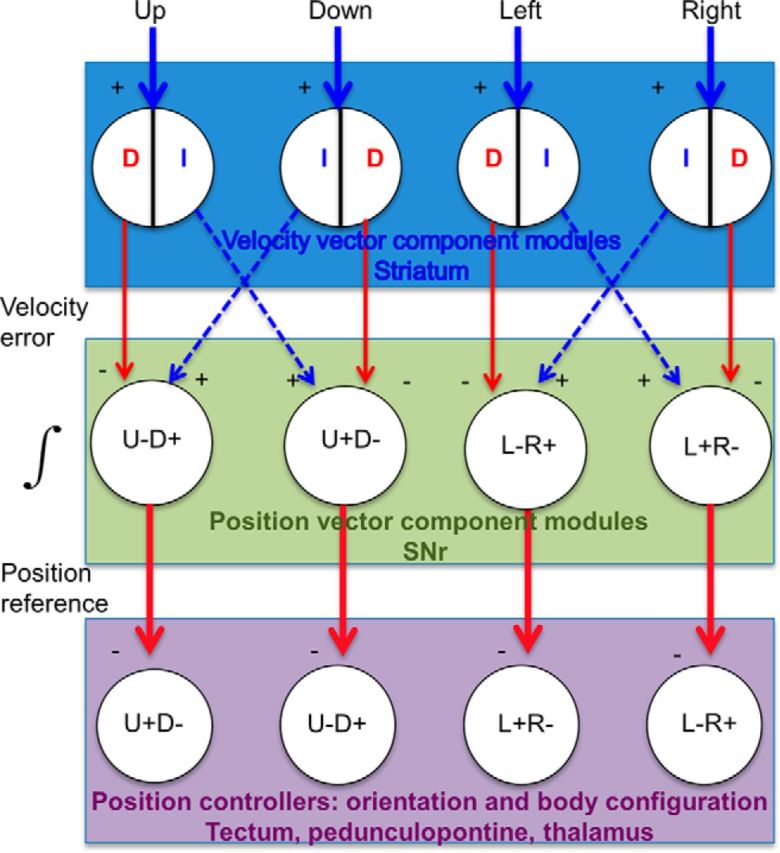
The basal ganglia (BG) are implicated in many movement disorders, yet how they contribute to movement remains unclear. Using wireless in vivo recording, we measured BG output from the substantia nigra pars reticulata (SNr) in mice while monitoring their movements with video tracking. The firing rate of most nigral neurons reflected Cartesian coordinates (either x- or y-coordinates) of the animal's head position during movement. The firing rates of SNr neurons are either positively or negatively correlated with the coordinates. Using an egocentric reference frame, four types of neurons can be classified: each type increases firing during movement in a particular direction (left, right, up, down), and decreases firing during movement in the opposite direction. Given the high correlation between the firing rate and the x and y components of the position vector, the movement trajectory can be reconstructed from neural activity. Our results therefore demonstrate a quantitative and continuous relationship between BG output and behavior. Thus, a steady BG output signal from the SNr (i.e., constant firing rate) is associated with the lack of overt movement, when a stable posture is maintained by structures downstream of the BG. Any change in SNr firing rate is associated with a change in position (i.e., movement). We hypothesize that the SNr output quantitatively determines the direction, velocity, and amplitude of voluntary movements. By changing the reference signals to downstream position control systems, the BG can produce transitions in body configurations and initiate actions.

Keywords: GABA; Parkinson's disease; basal ganglia; substantia nigra.


Figures

Figure 1.
Figure 1.
In vivo electrophysiological recording and classification of single units. A, Illustration of the representative placement of electrode array in the SNr. B, Placement of the 4 × 4 electrode array as shown in representative coronal brain sections from three different mice. Red arrows indicate electrode tracks. Scale bar, 500 μm. C, Summary of electrode placements. The coronal sections are from the Allen Mouse Brain Atlas (Lein et al., 2007); http://mouse.brain-map.org/. D, Four representative examples of putative GABAergic neurons, showing the waveforms and interspike interval distribution. E, Plot of firing rate versus spike width. Neurons with wider action potentials are excluded (other).
Figure 2.
Figure 2.
Illustration of behavioral task and wireless recording. A, Illustration of in vivo wireless multielectrode recording and the behavioral task. The mouse perches on a small platform, where it is free to move, but locomotion is not possible as the platform is elevated. On its head is a miniaturized 16-channel wireless headstage (1.5 × 1 × 1.5 cm) weighing ∼3.8 g and connected to a chronically implanted multielectrode array targeting the SNr. Sucrose solution is delivered into the spout periodically, preceded by a brief tone. Position of the LED is defined on a Cartesian plot with the ordered pair (x, y). B, Illustration of variability in movement trajectory. Each color represents position change during a single trial. C, Diagram illustration of the movement to collect sucrose from the spout. D, Representative illustration of LED position from 45 consecutive trials in a session. The x- and y-coordinates are plotted separately.
Figure 3.
Figure 3.
Relationship between single-unit activity from SNr and raw position coordinates during movement. A, The firing rate of SNr neurons exhibits high correlation with instantaneous position coordinates. The position is defined from the edge of the frame in the captured image. Higher x-coordinate values indicate positions to the left of the resting neutral position, whereas lower x values indicate positions to the right. Raster plot of a neuron showing a positive correlation with x-coordinates of the head position as measured by the LED (X+ neuron, p < 0.001). The mouse initiates a movement, lowering its head and moving slightly to reach the spout, where sucrose solution (10%, 13 μl) is delivered ∼2 s later (transparent blue bar). Y+ neuron, Positive correlation with y-coordinates (p < 0.001); X neuron, negative correlation with x-coordinates (p < 0.001); Y neuron, negative correlation with y-coordinates (p < 0.001). Relative changes in firing rate and position are shown on the right y-axis. B, Correlation between firing rate and instantaneous position coordinates.
Figure 4.
Figure 4.
Summary of different types of nigral neurons. A, r values for the four types of neurons identified, showing high correlation between firing rate and either x- or y-coordinate. B, r values for the four types of neurons identified, showing much reduced correlation between firing rate and the alternative coordinate. For example, activity of X+ neurons is poorly correlated with the y-coordinate. C, Baseline firing rate during a 2 s period before trial onset. D, Timing of the neural activity (all four classes of neurons) in relation to movement. Cumulative probability distribution of the time it takes from reward delivery and the maximum or minimum value of the firing rates or position coordinates. For the position data, this is approximately the time it takes for the mouse to reach the farthest point from its resting position in either the x- or y-axis.
Figure 5.
Figure 5.
Summary of baseline neural activity and movement. A, Stability of position measure and firing rate. We extracted 10 s time windows during rest periods from all sessions. The position signal and the neural activity are shown. There is no systematic change in these measures during the rest period over the course of a session. B, Coefficient of variation (CV, SD/mean) in the position measure during a trial and during the rest period. During the rest period between trials, there is little movement as indicated by much lower CV values in the position. C, Correlation between firing rate and during the rest period, when there is little movement.
Figure 6.
Figure 6.
Normalization of firing rates in SNr neurons. A, Each row includes raw firing rates and normalized firing rates from two neurons, and corresponding position change from a different mouse. Left column, Raw firing rates of two neurons of a given type from a mouse. Middle column, Normalized firing rates of the same neurons. The rates are normalized by dividing by the baseline rate of each neuron. Right column, Position change. The relative change in position from baseline is shown, as absolute position values are defined by the edge of the camera frame. B, The range of baseline firing rates in neurons from the four different classes. Each graph represents the range of baseline firing rates from a single session. Data from all mice with multiple neurons from a class are shown. There is considerable variability in baseline firing rates, although the correlation with position coordinates is highly similar. C, Distribution of firing rate modulation (% of baseline) per millimeter. Most neurons show comparable degree of modulation relative to movement amplitude.
Figure 7.
Figure 7.
Relationship between firing rate and Cartesian coordinates is similar for both reward and air puff trials. A, Left, Firing rate of a Y+ neuron in relation to air puff/reward. The activity of the same neuron from both types of trials is shown. Right, Example movement trajectory for air puff and reward trials. The correlation between neural activity and Cartesian coordinates is high on both sucrose reward trials and air puff trials. B, Firing rate of a Y neuron. Same as above. C, Distribution of r values of all neurons recorded during both reward and air puff trials.
Figure 8.
Figure 8.
Single-unit activity from a single electrode compared with LFP signal from the same electrode. A, Probability of co-occurring neurons recorded from the same electrode. B, Illustration of the per-reward change in x- and y- coordinates during a single session. C, From the same session, 2 X+ neurons and 2 Y neurons are shown with their waveforms. All cells show high correlation with position coordinates. Correlation analysis is performed on data from a 10 s perireward time window (5 s before and 5 s after reward delivery). D, LFP recorded from the same electrode as X+ cell #1. Correlation between LFP and position coordinates is much weaker. E, The distribution of r values for all the recorded LFP channels. Of the 166 LFP channels analyzed, only 15 showed significant correlation with position coordinates (colored, p < 0.001). Thus, when activity is summed from different types of neurons, the resulting correlation between neural activity and position is weaker. The relatively rare examples of LFP being highly correlated with position coordinates suggest that neurons belonging to a particular class (e.g., X+) might be located close to each other.
Figure 9.
Figure 9.
Schematic illustration of different types of neurons. A, Illustration of hypothetical mouse movement in relation to the neural activity. The firing rates of the four types of neurons are shown. For this hypothetical example, 1 spike/s is equal to 1 unit of change in x- or y-coordinate. The units are arbitrary. The starting position is (9, 9). B, The mouse moves to its left and up. The LED position changes to (11, 11). C, Right, The mouse moves to a new position (6, 7). Relative to its start position, the change is (−3, −2). D, Schematic illustration of the relationship between neural activity in relation to movements in four directions. The illustration of neural activity does not represent actual data because we did not record all four types of neurons from a single animal during a session. Opponent activity was observed during movement in any direction. For example, Y+ (Up+) neurons increase their activity during upward movements and decrease their activity during downward movements. The opposite is true of Y (Down+) neurons.
Figure 10.
Figure 10.
Left+ (X+) neuron increases firing during leftward movement and decreases firing during rightward movement. A, Detailed illustration of the correlation between firing rate and x-coordinates on a trial-by-trial basis. Neural activity and x-coordinates from 10 consecutive trials are shown. Each row represents a single trial. B, Neural and position data from a single trial are selected and compared. x-axis position changes during each movement are reflected in the firing rate of this neuron. The mouse moves to the right to consume sucrose. The activity of the neuron decreased during the rightward movement and then increased when the mouse moves left again to recover its initial starting position. C, Average firing rate changes and changes in different movement parameters. In this example, the y-component of the movement is much smaller. The plots on the right show velocity and acceleration data for the same movements. D, Using an egocentric reference frame, the direction of firing rate changes corresponds to the direction of movement. There was a positive correlation between neural activity and position change in a leftward direction (r = 0.99, p < 0.001). The correlation with the nonpreferred Cartesian axis is also shown. The diagram on the right shows the gradient of firing rate in relation to position coordinates.
Figure 11.
Figure 11.
Right+ (X) neuron increases firing during rightward movement and decreases firing during leftward movement. A, Detailed illustration of the correlation between firing rate and x-coordinates on a trial-by-trial basis. Neural activity and x-coordinates from 10 consecutive trials are shown. Each row represents a single trial. B, Neural and position data from a single trial are selected and compared. x-axis position changes during each movement are reflected in the firing rate of this neuron. C, Average firing rate changes and changes in different movement parameters. The plots on the right show velocity and acceleration data for the same movements. D, Using an egocentric reference frame, the direction of firing rate changes corresponds to the direction of movement. There was therefore a negative correlation between firing rate and raw x-coordinate value but a positive correlation between firing rate and distance in the rightward direction (p < 0.001). The correlation with the nonpreferred Cartesian axis is also shown. The diagram on the right shows the gradient of firing rate in relation to position coordinates.
Figure 12.
Figure 12.
Up+ (Y+) neuron increases firing during upward movement and decreases firing during downward movement. A, Detailed illustration of the correlation between firing rate and y-coordinates on a trial-by-trial basis. Neural activity and y-coordinates from 10 consecutive trials are shown. Each row represents a single trial. B, Neural and position data from a single trial are selected and compared. C, Average firing rate changes and changes in different movement parameters. The plots on the right show velocity and acceleration data for the same movements. D, There is a positive correlation between firing rate and y-coordinates and distance in the upward direction (p < 0.001). Using an egocentric reference frame, the direction of firing rate changes corresponds to the direction of movement. The correlation with the nonpreferred Cartesian axis is also shown. The diagram on the right shows the gradient of firing rate in relation to position coordinates.
Figure 13.
Figure 13.
Down+ (Y) neuron increases firing during downward movement and decreases firing during upward movement. A, Detailed illustration of the correlation between firing rate and y-coordinates on a trial-by-trial basis. Neural activity and y-coordinates from 10 consecutive trials are shown. Each row represents a single trial. B, Neural and position data from a single trial are selected and compared. C, Average firing rate changes and changes in different movement parameters. The plots on the right show velocity and acceleration data for the same movements. D, Using an egocentric reference frame, the direction of firing rate changes corresponds to the direction of movement (p < 0.001). There was therefore a negative correlation between firing rate and raw y-coordinate value but a positive correlation between firing rate and distance in the downward direction (p < 0.001). The correlation with the nonpreferred Cartesian axis is also shown. In this case, the correlation with distance traveled in the leftward direction is also high because the movement is nearly diagonal, so that the x and y position changes are similar. However, the correlation with y is still considerably higher, and trial-by-trial examination of the data confirms that this neuron is selective for the y component of the position vector. The diagram on the right shows the gradient of firing rate in relation to position coordinates.
Figure 14.
Figure 14.
Hypothetical BG circuit. SNr neurons receive projections from the striatum and external globus pallidus, via the direct (D, striatonigral) and indirect (I, striatopallidal) pathways. Although these projections are GABAergic, the net effect on the SNr can be either inhibitory (−) or excitatory (disinhibitory, +). Both types of signals, corresponding to a velocity error signal from the striatum, enter the SNr integrator, which is assumed to be leaky. Of course, direct and indirect pathways are not the only possible neural implementation of the proposed circuit. The key component is a phase splitter that generates opponent position reference signals from the SNr to the relevant downstream position controllers. Similar to reciprocal inhibition in the spinal cord, the proposed circuit generates opponent outputs for movement in any direction. For example, for upward movement, the indirect pathway neurons in the “Up” module increase the firing rate of SNr “Up+” neurons, whereas the direct pathway from the same module decreases the firing rate of SNr “Down+” neurons. The coordinated opponent outputs from this module generate movement in the desired direction. The rate of SNr output reflects the time integral of the striatal output. The striatum, especially the sensorimotor region, is hypothesized to contain at least four different modules, each responsible for movement in a specific direction. Because z-axis motion has not been measured, only four directions are illustrated here. Two of the four vector components are associated with any movement (e.g., upward and rightward), as movements usually have both horizontal and vertical components. The total output (number of spikes) from a particular striatal module represents the magnitude of the isolated position vector component, and the firing rate represents velocity (Kim et al., 2014). Using the outputs from different vector component modules, this circuit can perform vector addition to generate the resultant vector.

Similar articles

Cited by

References

    1. Albin RL, Young AB, Penney JB. The functional anatomy of basal ganglia disorders. Trends Neurosci. 1989;12:366–375. doi: 10.1016/0166-2236(89)90074-X. - DOI - PubMed
    1. Atherton JF, Bevan MD. Ionic mechanisms underlying autonomous action potential generation in the somata and dendrites of GABAergic substantia nigra pars reticulata neurons in vitro. J Neurosci. 2005;25:8272–8281. doi: 10.1523/JNEUROSCI.1475-05.2005. - DOI - PMC - PubMed
    1. Barter JW, Castro S, Sukharnikova T, Rossi MA, Yin HH. The role of the substantia nigra in posture control. Eur J Neurosci. 2014;39:1465–1473. doi: 10.1111/ejn.12540. - DOI - PubMed
    1. Basso MA, Wurtz RH. Neuronal activity in substantia nigra pars reticulata during target selection. J Neurosci. 2002;22:1883–1894. - PMC - PubMed
    1. Bernstein N. The coordination and regulation of movements. Oxford: Pergamon; 1967.

Publication types

Substances

LinkOut - more resources