. 2015 Feb 11;35(6):2766-77.
doi: 10.1523/JNEUROSCI.3134-14.2015.

A functional link between MT neurons and depth perception based on motion parallax

Affiliations

A functional link between MT neurons and depth perception based on motion parallax

HyungGoo R Kim et al. J Neurosci. .

Abstract

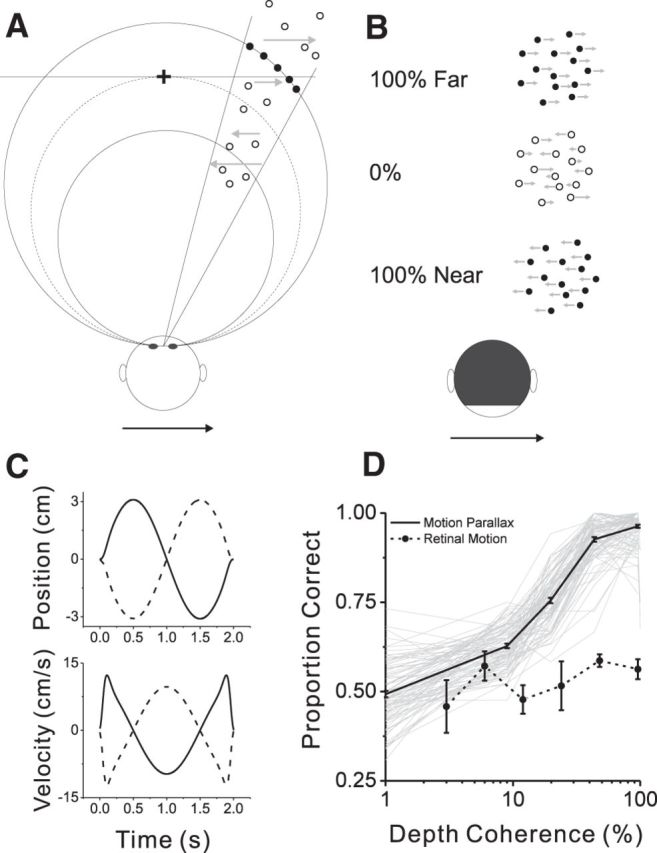
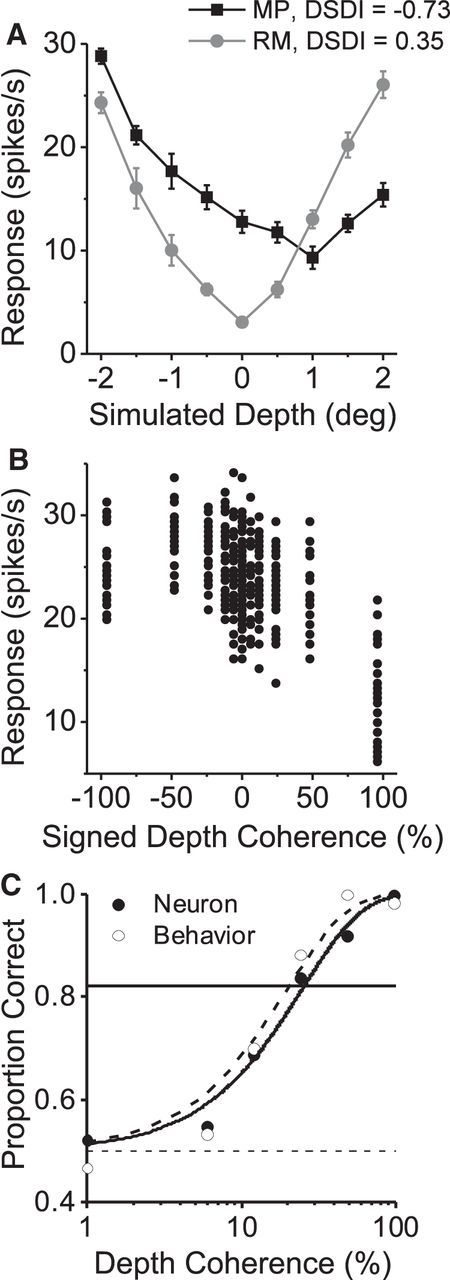
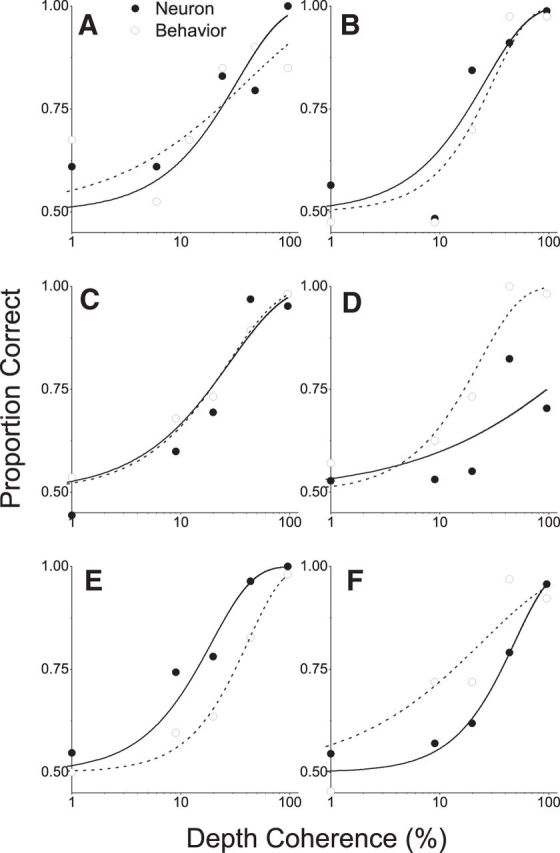
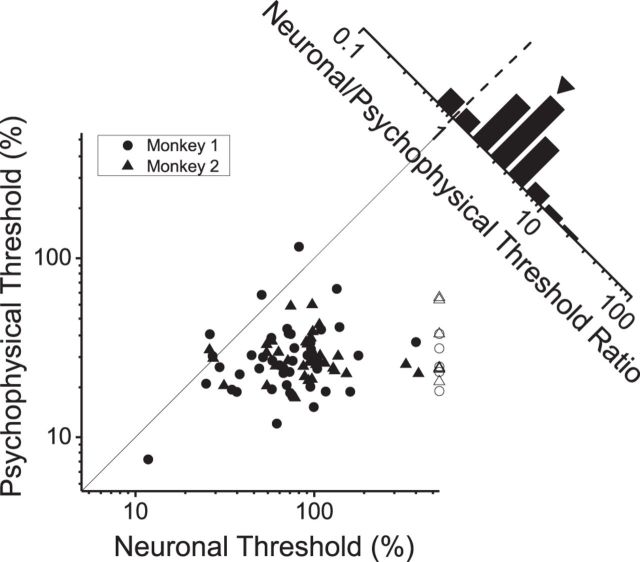
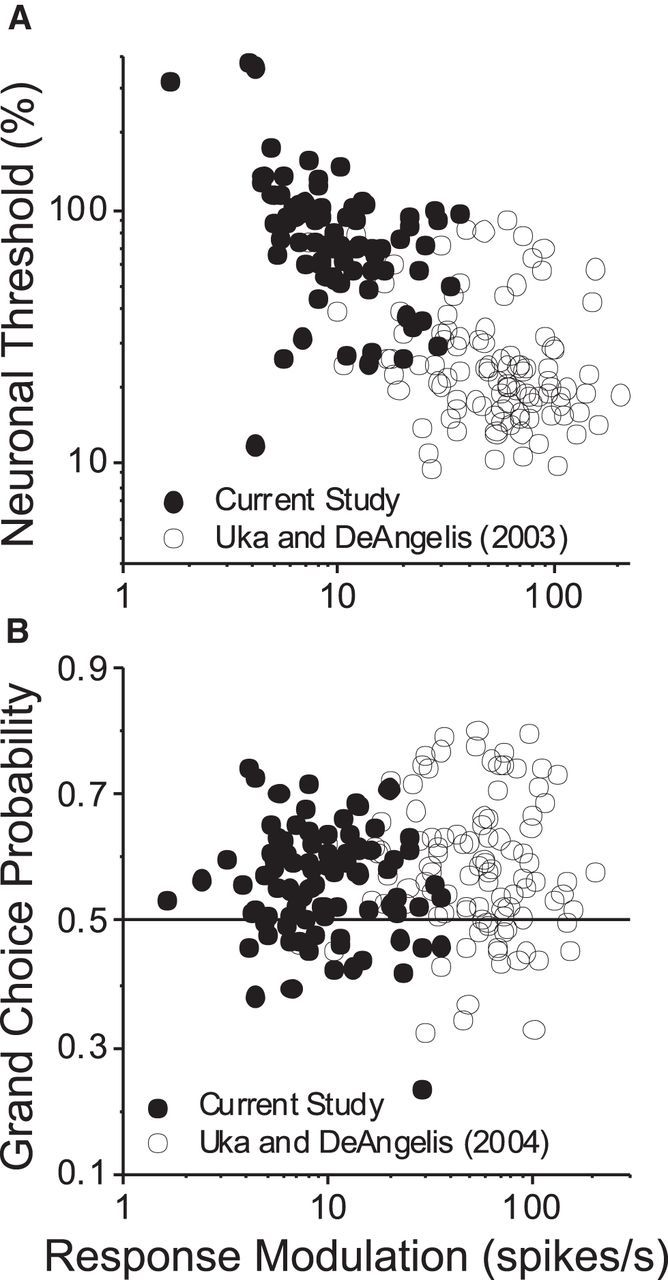
As an observer translates, objects lying at different distances from the observer have differential image motion on the retina (motion parallax). It is well established psychophysically that humans perceive depth rather precisely from motion parallax and that extraretinal signals may be used to correctly perceive the sign of depth (near vs far) when binocular and pictorial depth cues are absent or weak. However, the neural basis for this capacity remains poorly understood. We have shown previously that neurons in the macaque middle temporal (MT) area combine retinal image motion with smooth eye movement command signals to signal depth sign from motion parallax. However, those studies were performed in animals that were required simply to track a visual target, thus precluding direct comparisons between neural activity and behavior. Here, we examine the activity of MT neurons in rhesus monkeys that were trained to discriminate depth sign based on motion parallax, in the absence of binocular disparity and pictorial depth cues. We find that the most sensitive MT neurons approach behavioral sensitivity, whereas the average neuron is twofold to threefold less sensitive than the animal. We also find that MT responses are predictive of perceptual decisions (independent of the visual stimulus), consistent with a role for MT in providing sensory signals for this behavior. Our findings suggest that, in addition to its established roles in processing stereoscopic depth, area MT is well suited to contribute to perception of depth based on motion parallax.

Keywords: decision; depth; macaque; motion parallax; sensitivity.


Figures

Figure 1.
Figure 1.
Depth discrimination task and behavioral performance. A, Top-down view illustrating the random-dot stimulus for the discrimination task. For each trial, signal dots (filled circles) were presented at either a near or far depth (solid curves). Depth coherence determines the proportion of signal dots, whereas the remaining noise dots (open circles) were distributed over a range of depths. Filled and open symbols are used here for illustrative purpose only; signal and noise dots were identical in the actual display. B, Three examples of image motion associated with rightward translation of the animal. At 100% depth coherence, all dots move rightward when the depth is far (top row), whereas all dots move leftward when the depth is near (bottom row). At 0% depth coherence, dots move in both directions (middle row). C, Animals were translated sinusoidally along an axis in the frontoparallel plane. The time courses of position (top) and velocity (bottom) of whole-body movement along the axis of translation are shown. D, Psychometric functions are shown for all individual sessions (gray, n = 91), along with the mean (thick black trace). Filled symbols and dashed curve show the mean psychometric function from seven sessions in which the animals were not physically translated and no extraretinal signals were present. Error bars denote SEM.
Figure 2.
Figure 2.
Computation of neuronal performance and its comparison with behavior. A, Depth tuning curves of an example MT neuron are shown for the MP (black) and RM (gray) conditions. B, Firing rates for individual trials of the discrimination task are plotted against signed depth coherence for the same example neuron. Negative and positive coherences correspond to near and far signal dots, respectively. C, Ideal observer performance is plotted against the magnitude of depth coherence (filled symbols) to construct a neurometric function. Open symbols, Behavioral performance in the same session. Smooth curves show Weibull functions that were fitted to the neuronal (solid curve) and psychophysical (dashed curve) data.
Figure 3.
Figure 3.
Neurometric and psychometric functions for six example neurons. Format as in Figure 2C. A–C, Example neurons with sensitivity comparable with behavior. D, F, Example neurons that are less sensitive than the animal. E, An example neuron that is more sensitive than behavior in the corresponding session.
Figure 4.
Figure 4.
Summary of neuronal and behavioral sensitivity. Psychophysical threshold is plotted against neuronal threshold for each of the 91 recording sessions. Circles and triangles show data from monkeys 1 and 2, respectively. The diagonal histogram shows the distribution of neuronal/psychophysical threshold ratios. For a small number of insensitive neurons (7 of 41 from monkey 1, 5 of 50 from monkey 2), thresholds could not be estimated reliably (open symbols). These data are plotted here at a threshold value of 500% just for visualization, and these neurons were excluded from the computation of the geometric mean (arrowhead above the histogram).
Figure 5.
Figure 5.
Example of choice-dependent response and summary of choice probability data. A, Responses of an example neuron to 0% depth coherence were sorted into two groups according to the monkey's choice (preferred choices, filled bars; null choices, open bars). Inset, The depth tuning curve of this example neuron. Filled and open triangles indicate the preferred and nonpreferred depths of signal dots in the discrimination task, respectively. B, Summary of CPs measured at 0% coherence. Filled bars indicate neurons for which the CP was significantly different from 0.5 (permutation test, p < 0.05). Arrowhead, Mean choice probability. Eighty-two neurons are included in this plot, provided that the ratio of choices at 0% coherence was no more imbalanced than 3:1. C, Responses of the same neuron were z-scored separately for each depth coherence and pooled into a single pair of distributions to compute grand CP. D, Summary of grand CPs for all 91 neurons in the sample. Format as in B.
Figure 6.
Figure 6.
Stimulus variation does not contribute to choice probability. A, Distributions of CPs for subsets of neurons tested in the VAR (n = 43) and NOVAR (n = 32) conditions (for details, see Results). Neurons are included here if the ratio of choices at 0% coherence was no more imbalanced than 3:1. Arrowheads denote mean values. B, For sessions with a choice bias <3:1 for both VAR and NOVAR conditions (n = 30), CP in the NOVAR condition is plotted against CP in the VAR condition. Error bars denote 95% confidence intervals.
Figure 7.
Figure 7.
Relationship between CP and congruency of depth tuning for disparity and MP. A, Depth tuning curves for an example congruent neuron that prefers near depths for both MP (open symbols) and disparity (filled symbols). Error bars denote SEM. B, Depth tuning curves for an example opposite cell. Format as in A. C, Distributions of grand CPs for congruent (n = 32, black bars) and opposite (n = 27, gray bars) cells. Congruent cells are defined as having DSDI values for the two depth cues that are both significantly different from 0 but with the same sign. Opposite cells have significant DSDI values for both cues that are opposite in sign. Arrowheads denote mean values. D, Grand CPs computed according to the preferred disparity of each neuron (n = 91; for details, see Results).
Figure 8.
Figure 8.
Oculomotor errors cannot account for observed CPs. A, z-Scored spike rates of an example neuron are plotted against the corresponding pursuit gain for each trial. The Pearson's correlation coefficient between firing rate and pursuit gain (Rfr,pg) was −0.17 (p < 0.01). B, CP is plotted against the absolute value of Rfr,pg for our sample of 91 neurons. Filled symbols, Neurons with significant grand CPs. Circles and triangles show data from monkeys 1 and 2, respectively. Sig, Significant; NS, not significant. C, We computed a pursuit-corrected grand CP after partialing out the effect of pursuit gain (i.e., from the residuals of the regression shown in A). Grand CP is plotted against pursuit-corrected CP for our sample of 91 neurons.
Figure 9.
Figure 9.
Comparison of neuronal thresholds and CPs between disparity and MP tasks. A, Neuronal threshold is plotted as a function of response modulation for populations of neurons from the present study (n = 79; filled symbols) and that of Uka and DeAngelis (2003) (n = 104; open symbols). Response modulation is defined as the difference in firing rate between the preferred and null depths for each neuron, at 100% depth coherence. For neurons in the present study, preferred and null depths were constrained to be symmetric around 0 depth, whereas they were generally chosen to lie at the peak and trough of the disparity tuning curve in the study of Uka and DeAngelis (2003). Data from neurons with thresholds that could not be estimated reliably (12 of 91 neurons in the present study with thresholds >500%) were excluded. ANCOVA was performed on the relationship between log threshold and log response modulation (for details, see Discussion). B, CP is plotted as a function of response modulation for 90 neurons from the present study (filled symbols) and 104 neurons from the study by Uka and DeAngelis (2004) (open symbols). ANCOVA was performed on the relationship between CP and log response modulation (for details, see Discussion).

Similar articles

Cited by

References

    1. Albright TD, Desimone R, Gross CG. Columnar organization of directionally selective cells in visual area MT of the macaque. J Neurophysiol. 1984;51:16–31. - PubMed
    1. Anzai A, Chowdhury SA, DeAngelis GC. Coding of stereoscopic depth information in visual areas V3 and V3A. J Neurosci. 2011;31:10270–10282. doi: 10.1523/JNEUROSCI.5956-10.2011. - DOI - PMC - PubMed
    1. Bradley DC, Chang GC, Andersen RA. Encoding of three-dimensional structure-from-motion by primate area MT neurons. Nature. 1998;392:714–717. doi: 10.1038/33688. - DOI - PubMed
    1. Britten KH, Shadlen MN, Newsome WT, Movshon JA. The analysis of visual motion: a comparison of neuronal and psychophysical performance. J Neurosci. 1992;12:4745–4765. - PMC - PubMed
    1. Britten KH, Newsome WT, Shadlen MN, Celebrini S, Movshon JA. A relationship between behavioral choice and the visual responses of neurons in macaque MT. Vis Neurosci. 1996;13:87–100. doi: 10.1017/S095252380000715X. - DOI - PubMed

Publication types