. 2015 Feb 11;35(6):2817-29.
doi: 10.1523/JNEUROSCI.3516-14.2015.

The JAK/STAT3 pathway is a common inducer of astrocyte reactivity in Alzheimer's and Huntington's diseases

Affiliations

The JAK/STAT3 pathway is a common inducer of astrocyte reactivity in Alzheimer's and Huntington's diseases

Lucile Ben Haim et al. J Neurosci. .

Abstract

Astrocyte reactivity is a hallmark of neurodegenerative diseases (ND), but its effects on disease outcomes remain highly debated. Elucidation of the signaling cascades inducing reactivity in astrocytes during ND would help characterize the function of these cells and identify novel molecular targets to modulate disease progression. The Janus kinase/signal transducer and activator of transcription 3 (JAK/STAT3) pathway is associated with reactive astrocytes in models of acute injury, but it is unknown whether this pathway is directly responsible for astrocyte reactivity in progressive pathological conditions such as ND. In this study, we examined whether the JAK/STAT3 pathway promotes astrocyte reactivity in several animal models of ND. The JAK/STAT3 pathway was activated in reactive astrocytes in two transgenic mouse models of Alzheimer's disease and in a mouse and a nonhuman primate lentiviral vector-based model of Huntington's disease (HD). To determine whether this cascade was instrumental for astrocyte reactivity, we used a lentiviral vector that specifically targets astrocytes in vivo to overexpress the endogenous inhibitor of the JAK/STAT3 pathway [suppressor of cytokine signaling 3 (SOCS3)]. SOCS3 significantly inhibited this pathway in astrocytes, prevented astrocyte reactivity, and decreased microglial activation in models of both diseases. Inhibition of the JAK/STAT3 pathway within reactive astrocytes also increased the number of huntingtin aggregates, a neuropathological hallmark of HD, but did not influence neuronal death. Our data demonstrate that the JAK/STAT3 pathway is a common mediator of astrocyte reactivity that is highly conserved between disease states, species, and brain regions. This universal signaling cascade represents a potent target to study the role of reactive astrocytes in ND.

Keywords: SOCS3; STAT3; animal models; lentiviral vector; neurodegenerative diseases; reactive astrocytes.


Figures

Figure 1.
Figure 1.
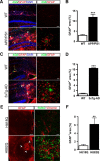
Mouse models of AD and HD display astrocyte reactivity in vulnerable regions of the brain. A–C, Images of brain sections from mouse models of AD showing double staining for amyloid plaques (4G8, green) and astrocytes (GFAP, red). A, GFAP is strongly expressed in hippocampal astrocytes of 8-month-old APP/PS1dE9 mice around amyloid depositions (arrowheads) in the stratum lacunosum moleculare and the dentate gyrus. B, Quantification of the GFAP+ area in the hippocampus of APP/PS1dE9 and WT mice. C, In the subiculum, 3xTg-AD mice display amyloid depositions that are surrounded by GFAP+ reactive astrocytes (arrowheads). D, Quantification of the GFAP+ area in the subiculum of 12-month-old 3xTg-AD mice and age-matched WT mice. E, Mice injected with lenti-Htt82Q in the striatum display EM48+ aggregates of mHtt (green). Expression of the mHtt in striatal neurons leads to astrocyte reactivity (arrowheads) as shown by increased GFAP and vimentin staining (red). F, Quantification of the GFAP+ area in the lenti-Htt82Q-injected striatum relative to the control striatum injected with lenti-Htt18Q. n = 3–6 per group. **p < 0.01, ***p < 0.001. Scale bars: A and C, left, 100 μm; right, 20 μm; E, left, 200 μm; right, 20 μm.
Figure 2.
Figure 2.
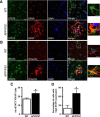
The JAK/STAT3 pathway is activated in reactive astrocytes in APP/PS1dE9 mice. A, B, Images of brain sections from 8-month-old APP/PS1dE9 mice showing double staining for STAT3 (green) and reactive astrocyte markers (A, GFAP; B, vimentin). APP/PS1dE9 mice display reactive astrocytes that overexpress GFAP, vimentin, and STAT3 around amyloid plaques (arrowhead) in the hippocampus. STAT3 accumulates in the nucleus of reactive astrocytes (see enlargement). C, The number of GFAP+ astrocytes coexpressing STAT3 in the nucleus (nSTAT3+/GFAP+ cells) is significantly higher in APP/PS1dE9 mice than in WT mice. D, The percentage of cells showing strong staining for STAT3 is higher in APP/PS1dE9 mice than in WT mice. n = 3–4 per group. *p < 0.05. Scale bars: 20 μm; enlargements, 5 μm.
Figure 3.
Figure 3.
The JAK/STAT3 pathway is activated in reactive astrocytes in 3xTg-AD mice. A, B, Images of brain sections from the subiculum of 12-month-old 3xTg-AD mice. STAT3 (green) accumulates in the nucleus of reactive astrocytes labeled with GFAP (A, red) or vimentin (B, red), especially around amyloid plaques (arrowheads). C, The number of nSTAT3+/GFAP+ cells is significantly higher in 3xTg-AD mice than in age-matched WT controls. n = 3–5 per group. ***p < 0.001. Scale bars: 20 μm; enlargements, 5 μm.
Figure 4.
Figure 4.
The JAK/STAT3 pathway is activated in reactive astrocytes in the mouse model of HD. A, Images of brain sections showing double staining for GFAP (red) and STAT3 (green) on mouse brain sections, 6 weeks after the infection of striatal neurons with lenti-Htt18Q or lenti-Htt82Q. Astrocytes in the Htt82Q striatum are hypertrophic and express higher levels of STAT3 in their nucleus relative to resting astrocytes in the Htt18Q striatum. B, C, The number of nSTAT3+/GFAP+ cells (B) and the percentage of cells displaying strong staining for STAT3 (C) are significantly higher in the Htt82Q striatum than in the Htt18Q striatum. n = 6. **p < 0.01, ***p < 0.001. Scale bars: 20 μm; enlargements, 5 μm.
Figure 5.
Figure 5.
The JAK/STAT3 pathway is activated in reactive astrocytes in the primate model of HD. A, Images of brain sections from macaques injected with lenti-Htt82Q in the putamen showing triple staining for STAT3 (green), GFAP (red), and EM48 (magenta). Seventeen months after infection with lenti-Htt82Q in the putamen, EM48+ aggregates of mHtt are observed, as well as prominent astrocyte reactivity. The immunoreactivity for STAT3 is much stronger in GFAP+ reactive astrocytes than in resting astrocytes found outside the injected area in the same animal. Images are representative of all three macaques. Scale bars: 40 μm; enlargement, 10 μm.
Figure 6.
Figure 6.
The NF-κB pathway is not activated in 3xTg-AD mice and the lentiviral-based model of HD. Western blot for IκBα and GAPDH in 3xTg-AD mice (3xTg) or their age-matched WT controls (A) or mice injected in the left striatum with lenti-Htt18Q (18Q) and in the right striatum with lenti-Htt82Q (82Q; B). IκBα expression is similar between 3xTg-AD and WT mice and between the left and right striatum of mice injected with lenti-Htt. The abundance of IκBα is lower in HeLa cells treated with TNFα (positive control, +) than in untreated cells (negative control, −). n = 4–6 mice per group.
Figure 7.
Figure 7.
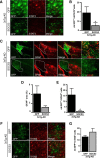
The JAK/STAT3 pathway is responsible for astrocyte reactivity in 3xTg-AD mice. A, Images of double staining for GFP (green) and STAT3 (red) in 7- to 8-month-old 3xTg-AD mice injected in the subiculum with lenti-GFP or lenti-SOCS3 plus lenti-GFP (same total virus load). STAT3 expression becomes undetectable in astrocytes infected with lenti-SOCS3. B, The number of GFP+ astrocytes coexpressing STAT3 in the nucleus (GFP+/nSTAT3+ cells) is significantly lower in the SOCS3 group than in the GFP control group. C, Images of GFP (green) and GFAP (red) staining in brain sections from 3xTg-AD mice injected with lenti-GFP or lenti-SOCS3 plus lenti-GFP in the subiculum. Lenti-SOCS3 injection strongly reduces GFAP expression in the injected area (delimited by white dots) in 3xTg-AD mice. Note that infected astrocytes in the SOCS3 group have a bushy morphology typical of resting astrocytes, whereas cells in the GFP group are hypertrophic with enlarged primary processes. D, Quantification of the GFAP+ area in 3xTg-AD mice injected with lenti-SOCS3 plus lenti-GFP or lenti-GFP alone. E, The number of GFP+ astrocytes coexpressing GFAP is significantly lower in the SOCS3 group than in the GFP control group. F, Immunofluorescent labeling for the astrocyte marker S100β. G, Quantification of the number of infected astrocytes coexpressing S100β (GFP+/S100β+ cells) shows that its expression is not altered by SOCS3. n = 3–5 per group. *p < 0.05. Scale bars: A and F, 20 μm; C, left, 500 μm; right, 20 μm. Infected astrocytes in both groups are identified by their expression of GFP.
Figure 8.
Figure 8.
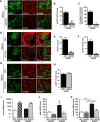
The JAK/STAT3 pathway is responsible for astrocyte reactivity in the lentiviral-based mouse model of HD. A, Immunofluorescent staining of GFP (green) and STAT3 (red) in mice injected in the left striatum with lenti-Htt82Q plus lenti-GFP and the right striatum with lenti-Htt82Q plus lenti-SOCS3 plus lenti-GFP. STAT3 expression becomes undetectable in astrocytes infected with lenti-SOCS3. B, C, The number of GFP+/nSTAT3+ astrocytes (B) and the percentage of cells showing strong staining for STAT3 (C) is significantly lower in the right striatum injected with lenti-SOCS3 than in the control striatum. D, SOCS3 expression strongly reduces GFAP expression (red) in the injected area (GFP+, green). Infected astrocytes in the SOCS3 group display thin processes and complex ramifications, unlike hypertrophic reactive astrocytes in the control group. E, Quantification confirms that the GFAP+ area is significantly smaller in the striatum injected with lenti-SOCS3 than in the control striatum. F, The number of GFP+ astrocytes coexpressing GFAP is significantly lower in the striatum expressing SOCS3 than in the control striatum. G, Immunofluorescent staining for the astrocyte marker S100β (red). H, The number of GFP+/S100β+ cells is not different between the two groups. I–K, qRT-PCR analysis on mice injected in the striatum with lenti-Htt18Q plus lenti-GFP, lenti-Htt18Q plus lenti-SOCS3 plus lenti-GFP, lenti-Htt82Q plus lenti-GFP, or lenti-Htt82Q plus lenti-SOCS3 plus lenti-GFP (same total virus load). I, Socs3 mRNA is overexpressed >100 times after lenti-SOCS3 injection. The expression of gfap (J) and vimentin (K) is induced by lenti-Htt82Q and is restored to levels observed in the Htt18Q controls by the expression of SOCS3. Note that lenti-SOCS3 has no effect in resting astrocytes. n = 4–11 per group. *p < 0.05, **p < 0.01, ***p < 0.001. Scale bars: A and G, 20 μm; D, 500 μM; enlargement, 20 μm.
Figure 9.
Figure 9.
Preventing astrocyte reactivity reduces microglial activation. A, Immunofluorescent staining of GFP (green) and IBA1 (red) in mice injected in the left striatum with lenti-Htt82Q plus lenti-GFP and the right striatum with lenti-Htt82Q plus lenti-SOCS3 plus lenti-GFP. B, Quantification shows that the IBA1+ area is significantly smaller in the striatum injected with lenti-SOCS3 than in the control striatum. C–E, qRT-PCR analysis on mice injected in the striatum with lenti-Htt18Q plus lenti-GFP, lenti-Htt18Q plus lenti-SOCS3 plus lenti-GFP, lenti-Htt82Q plus lenti-GFP, or lenti-Htt82Q plus lenti-SOCS3 plus lenti-GFP (same total virus load). The expression of aif1 (iba1; C), itgam (CD11b; D), and ccl2 (E) is induced by lenti-Htt82Q and is reduced by SOCS3. n = 4–11 per group. *p < 0.05, **p < 0.01, ***p < 0.001, #p < 0.05 versus Htt18Q plus GFP and Htt18Q plus SOCS3. Scale bar, 20 μm.
Figure 10.
Figure 10.
Preventing astrocyte reactivity modulates HD pathology. Immunostaining of the striatal neuronal marker DARPP32 and histochemistry of COX in mice injected in the left striatum with lenti-Htt82Q plus lenti-GFP and in the right striatum with lenti-Htt82Q plus lenti-SOCS3 plus lenti-GFP. mHtt aggregates are detected by immunostaining with EM48 in the same mice, and they form nuclear inclusions (see enlargement). Quantification of the lesion size and the number of EM48+ aggregates. SOCS3 increases the number of EM48+ aggregates. n = 11. *p < 0.05. Scale bar, 500 μm.

Similar articles

Cited by

References

    1. Alvarez-Buylla A, García-Verdugo JM, Tramontin AD. A unified hypothesis on the lineage of neural stem cells. Nat Rev Neurosci. 2001;2:287–293. doi: 10.1038/35067582. - DOI - PubMed
    1. Anderson MA, Ao Y, Sofroniew MV. Heterogeneity of reactive astrocytes. Neurosci Lett. 2014;565:23–29. doi: 10.1016/j.neulet.2013.12.030. - DOI - PMC - PubMed
    1. Arrasate M, Finkbeiner S. Protein aggregates in Huntington's disease. Exp Neurol. 2012;238:1–11. doi: 10.1016/j.expneurol.2011.12.013. - DOI - PMC - PubMed
    1. Bjørbaek C, Elmquist JK, Frantz JD, Shoelson SE, Flier JS. Identification of SOCS-3 as a potential mediator of central leptin resistance. Mol Cell. 1998;1:619–625. doi: 10.1016/S1097-2765(00)80062-3. - DOI - PubMed
    1. Bonni A, Frank DA, Schindler C, Greenberg ME. Characterization of a pathway for ciliary neurotrophic factor signaling to the nucleus. Science. 1993;262:1575–1579. doi: 10.1126/science.7504325. - DOI - PubMed

Publication types

MeSH terms

Substances