. 2015 Jan 28:5:805.
doi: 10.3389/fpls.2014.00805. eCollection 2014.

Transcriptome and metabolome analysis of plant sulfate starvation and resupply provides novel information on transcriptional regulation of metabolism associated with sulfur, nitrogen and phosphorus nutritional responses in Arabidopsis

Affiliations

Transcriptome and metabolome analysis of plant sulfate starvation and resupply provides novel information on transcriptional regulation of metabolism associated with sulfur, nitrogen and phosphorus nutritional responses in Arabidopsis

Monika Bielecka et al. Front Plant Sci. .

Abstract

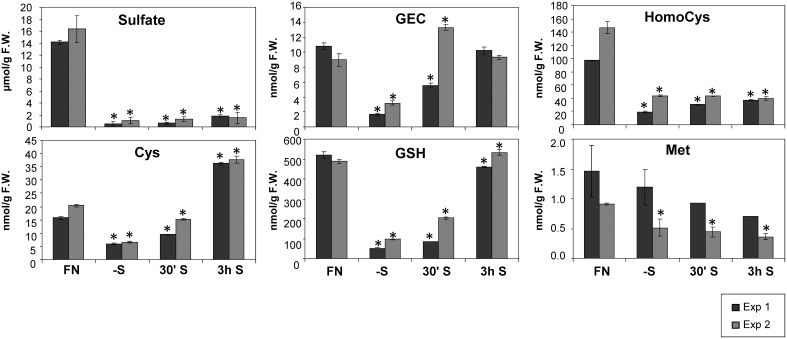
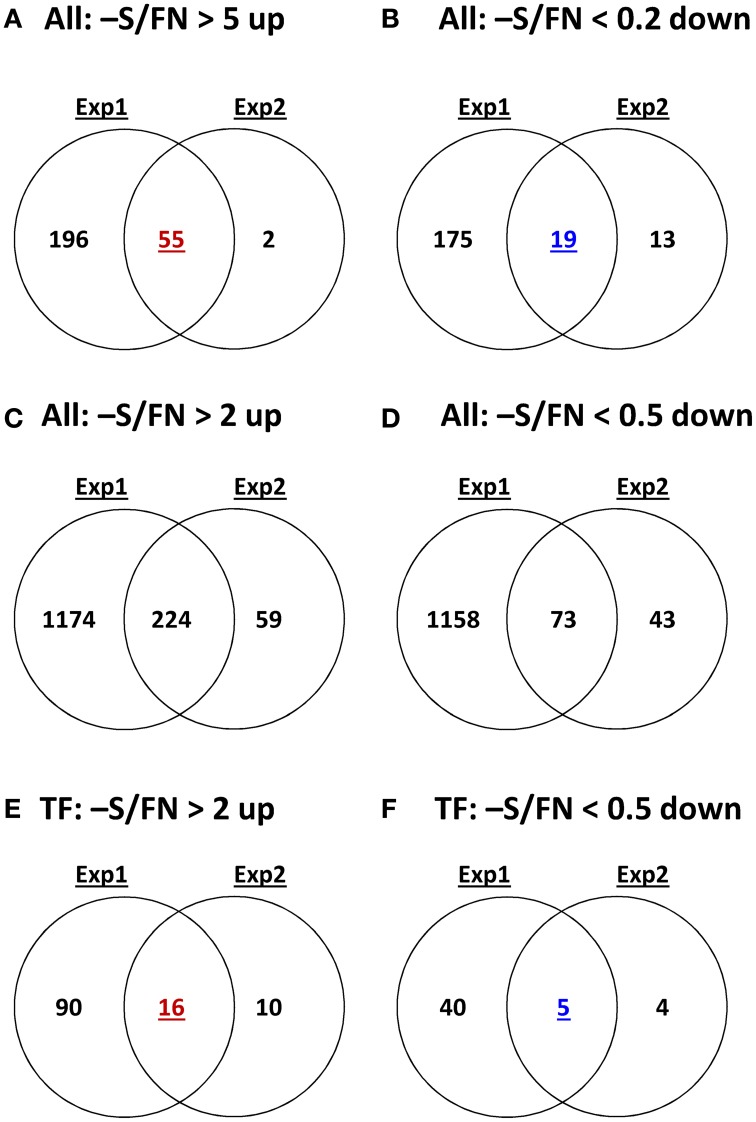
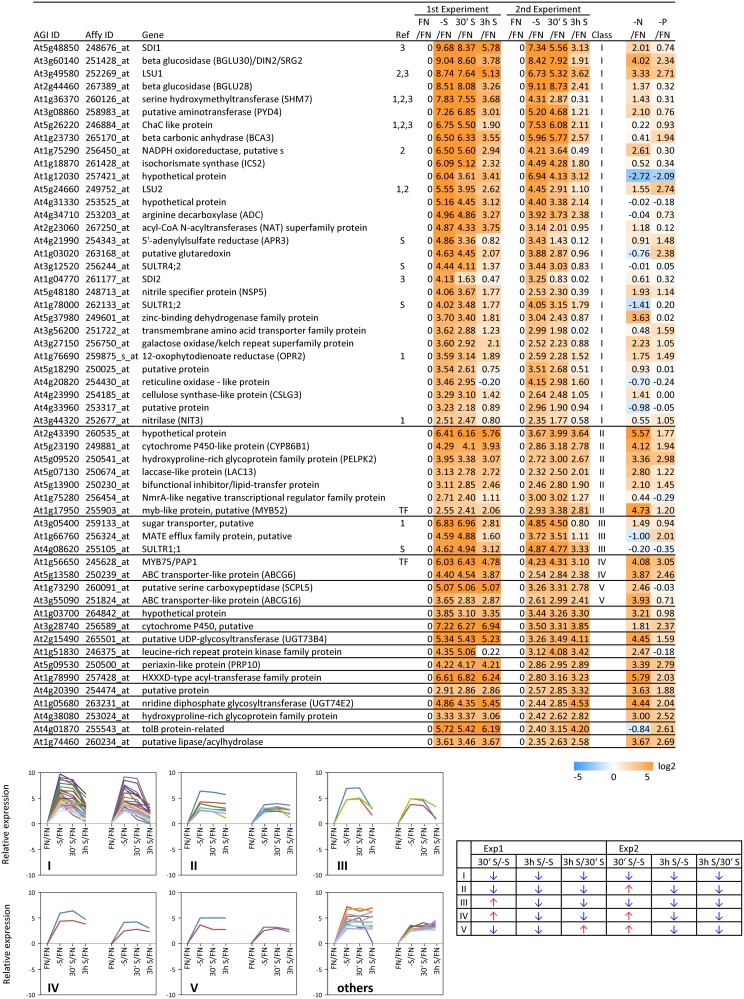
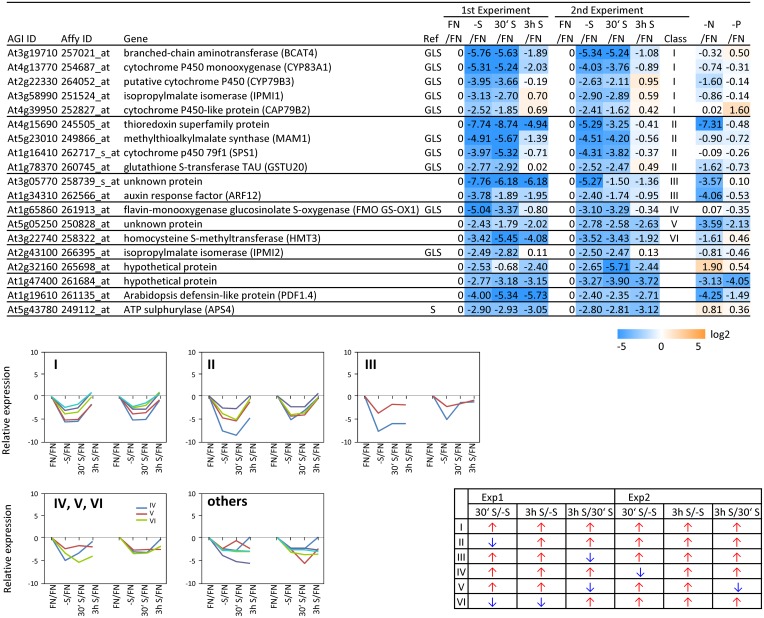
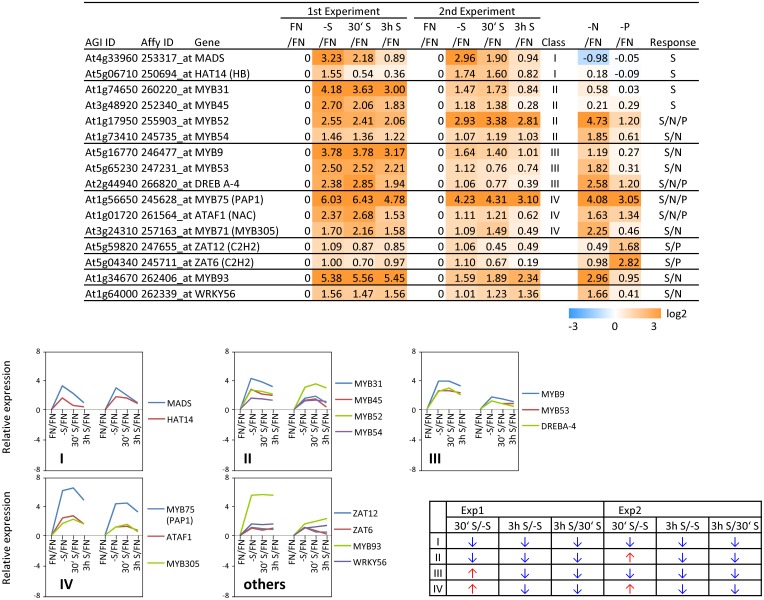
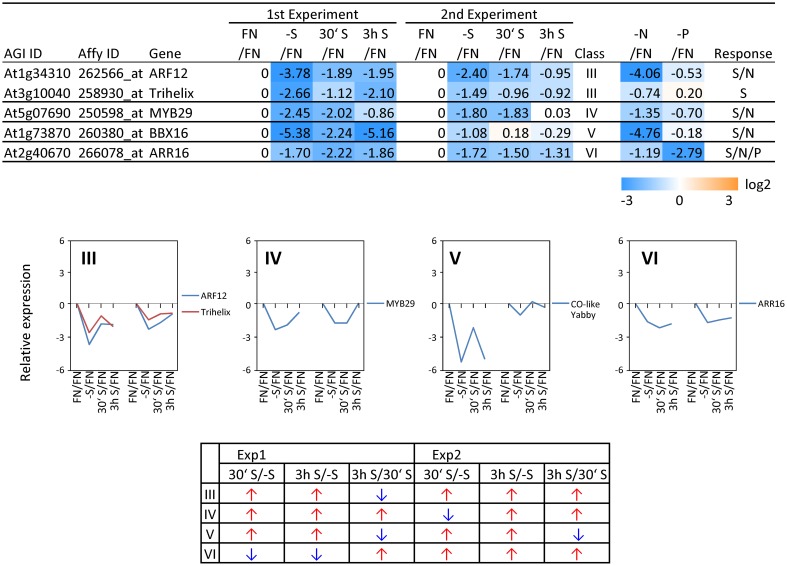
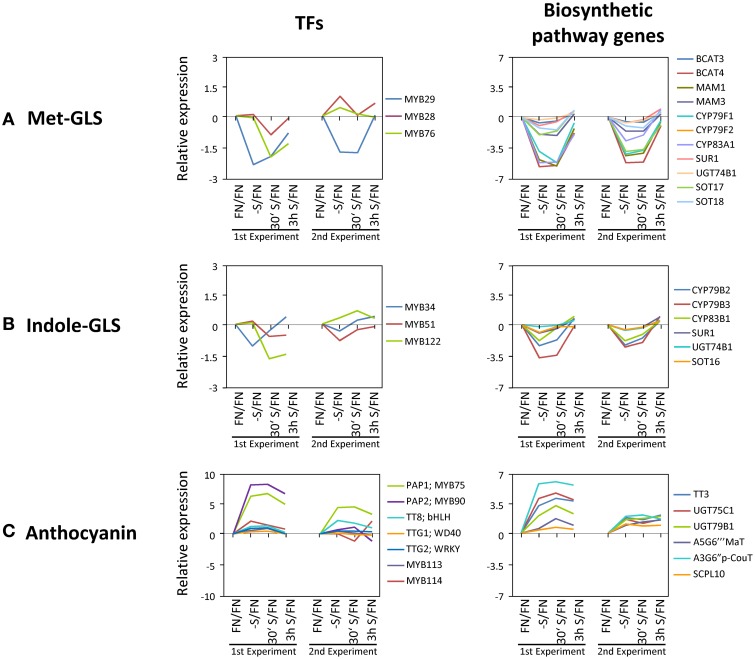
Sulfur is an essential macronutrient for plant growth and development. Reaching a thorough understanding of the molecular basis for changes in plant metabolism depending on the sulfur-nutritional status at the systems level will advance our basic knowledge and help target future crop improvement. Although the transcriptional responses induced by sulfate starvation have been studied in the past, knowledge of the regulation of sulfur metabolism is still fragmentary. This work focuses on the discovery of candidates for regulatory genes such as transcription factors (TFs) using 'omics technologies. For this purpose a short term sulfate-starvation/re-supply approach was used. ATH1 microarray studies and metabolite determinations yielded 21 TFs which responded more than 2-fold at the transcriptional level to sulfate starvation. Categorization by response behaviors under sulfate-starvation/re-supply and other nutrient starvations such as nitrate and phosphate allowed determination of whether the TF genes are specific for or common between distinct mineral nutrient depletions. Extending this co-behavior analysis to the whole transcriptome data set enabled prediction of putative downstream genes. Additionally, combinations of transcriptome and metabolome data allowed identification of relationships between TFs and downstream responses, namely, expression changes in biosynthetic genes and subsequent metabolic responses. Effect chains on glucosinolate and polyamine biosynthesis are discussed in detail. The knowledge gained from this study provides a blueprint for an integrated analysis of transcriptomics and metabolomics and application for the identification of uncharacterized genes.

Keywords: metabolomics; microarray; nitrate; phosphate; sulfate starvation; sulfur; transcription factor; transcriptomics.


Figures

Figure 1
Figure 1
Levels of sulfur related metabolites in Arabidopsis seedlings grown in liquid cultures under different sulfate regimes. Values ± SD characterize the average of three independent measurements. Asterisks indicate values that are significantly different (P < 0.05) in comparison to the respective FN controls. (FN, full nutrition; S, re-supplied sulfate).
Figure 2
Figure 2
Comparative analysis of the gene expression patterns under sulfate deficiency stress in two independent experimental replicates. Venn diagrams show the numbers of genes more than 5-fold or 2-fold significantly up-regulated or down-regulated genes in all genes or TF genes with P and M calls on -S or FN condition. P, present value; M, marginal value.
Figure 3
Figure 3
Relative expression level of up-regulated genes under sulfate starvation. Genes were up-regulated more than 5 times (55 genes) under sulfate deficient conditions in both experimental replicates. The up-regulated genes were classified into 6 clusters (class I–V, and others) according to responsiveness to sulfate resupply as indicated by fold changes (>1, upwards arrow; <1, downwards arrow) in transcript accumulations, 30' (30 min) S/-S, 3 h S/-S and 3 h S/30' S (Supplemental Table SIII). Genes already published as S-responding (Hirai and Saito, 2004) are marked with (1). Genes, in which promoters region (−3-kb upstream sequence) the SURE core sequence was found (Maruyama-Nakashita et al., 2005), are marked with (2). OAS responsive genes (Hubberten et al., 2012a, b), are marked with (3). Genes which are involved in sulfate uptake and reduction are marked in (S). Fold changes relative to the nitrate- and phosphate-sufficient control are shown. -N; data are from Scheible et al. (2004). -P; Morcuende et al. (2007). Values and colors are in log2 scale.
Figure 4
Figure 4
Relative expression level of down-regulated genes under sulfate starvation. Genes were down-regulated more than 5 times (19 genes) under sulfate deficient conditions in both experimental replicates. The down-regulated genes were classified into 7 clusters (class I–VI, and others) according to responsiveness to sulfate resupply as indicated by fold changes (>1, upwards arrow; <1, downwards arrow) in transcript accumulations, 30' (30 min) S/-S, 3 h S/-S and 3 h S/30' S (Supplemental Table SIII). Genes which are involved in sulfate reduction pathway and glucosinolate (GLS) biosynthetic pathway are marked with S and GLS, respectively. Fold changes relative to the nitrate- and phosphate-sufficient control are shown. -N; data are from Scheible et al. (2004). -P; Morcuende et al. (2007). Values and colors are in log2 scale.
Figure 5
Figure 5
Relative expression level of up-regulated transcription factors (TFs) under sulfate starvation. Transcription factors were up-regulated more than 2 times (16 genes) under sulfate deficient conditions in both experimental replicates. The up-regulated transcription factors were classified into the same 6 clusters as Figure 3 (class I–V, and others) according to responsiveness to sulfate resupply as indicated by fold changes (>1, upwards arrow; <1, downwards arrow) in transcript accumulations, 30′ (30 min) S/-S, 3 h S/-S and 3 h S/30′ S (Supplemental Table SIII). Fold changes relative to the nitrate- and phosphate-sufficient control are shown. -N; data are from Scheible et al. (2004). -P; Morcuende et al. (2007). Values and colors are in log2 scale.
Figure 6
Figure 6
Relative expression level of down-regulated transcription factors (TFs) under sulfate starvation. Transcription factors were down-regulated more than 2 times (5 genes) under sulfate deficient conditions in both experimental replicates. The down-regulated transcription factors were classified into the same 7 clusters as Figure 4 (class I–VI, and others) according to responsiveness to sulfate resupply as indicated by fold changes (>1, upwards arrow; <1, downwards arrow) in transcript accumulations, 30′ (30 min) S/-S, 3 h S/-S and 3 h S/30′ S (Supplemental Table SIII). Fold changes relative to the nitrate- and phosphate-sufficient control are shown. -N; data are from Scheible et al. (2004). -P; Morcuende et al. (2007). Values and colors are in log2 scale.
Figure 7
Figure 7
Figure 7. Gene expression changes in known transcription factors and the downstream genes. (A) Methionine derived glucosinolates (Met-GLSs). (B) Tryptophan derived glucosinolates (Indole-GLSs). (C) Anthocyanin AGI IDs and full names of genes are in Supplemental Table SV. Values are in log2 scale.

References

    1. Augustus A. M., Reardon P. N., Heller W. T., Spicer L. D. (2006). Structural basis for the differential regulation of DNA by the methionine repressor MetJ. J. Biol. Chem. 281, 34269–34276. 10.1074/jbc.M605763200 - DOI - PubMed
    1. Becker S. A., Palsson B. O. (2008). Context-specific metabolic networks are consistent with experiments. PLoS Comput. Biol. 4:e1000082. 10.1371/journal.pcbi.1000082 - DOI - PMC - PubMed
    1. Bhargava A., Mansfield S. D., Hall H. C., Douglas C. J., Ellis B. E. (2010). MYB75 functions in regulation of secondary cell wall formation in the Arabidopsis inflorescence stem. Plant Physiol. 154, 1428–1438. 10.1104/pp.110.162735 - DOI - PMC - PubMed
    1. Blakely L. M., Durham M., Evans T. A., Blakely R. M. (1982). Experimental studies on lateral root formation in radish seedling roots: I. General methods, developmental stages, spontaneous formation of laterals. Bot. Gaz. 143, 341–352. 10.1086/337308 - DOI
    1. Borevitz J. O., Xia Y. J., Blount J., Dixon R. A., Lamb C. (2000). Activation tagging identifies a conserved MYB regulator of phenylpropanoid biosynthesis. Plant Cell 12, 2383–2393. 10.1105/tpc.12.12.2383 - DOI - PMC - PubMed