. 2015 Feb 12;10(2):e0116704.
doi: 10.1371/journal.pone.0116704. eCollection 2015.

Effects of vendor and genetic background on the composition of the fecal microbiota of inbred mice

Affiliations

Effects of vendor and genetic background on the composition of the fecal microbiota of inbred mice

Aaron C Ericsson et al. PLoS One. .

Abstract

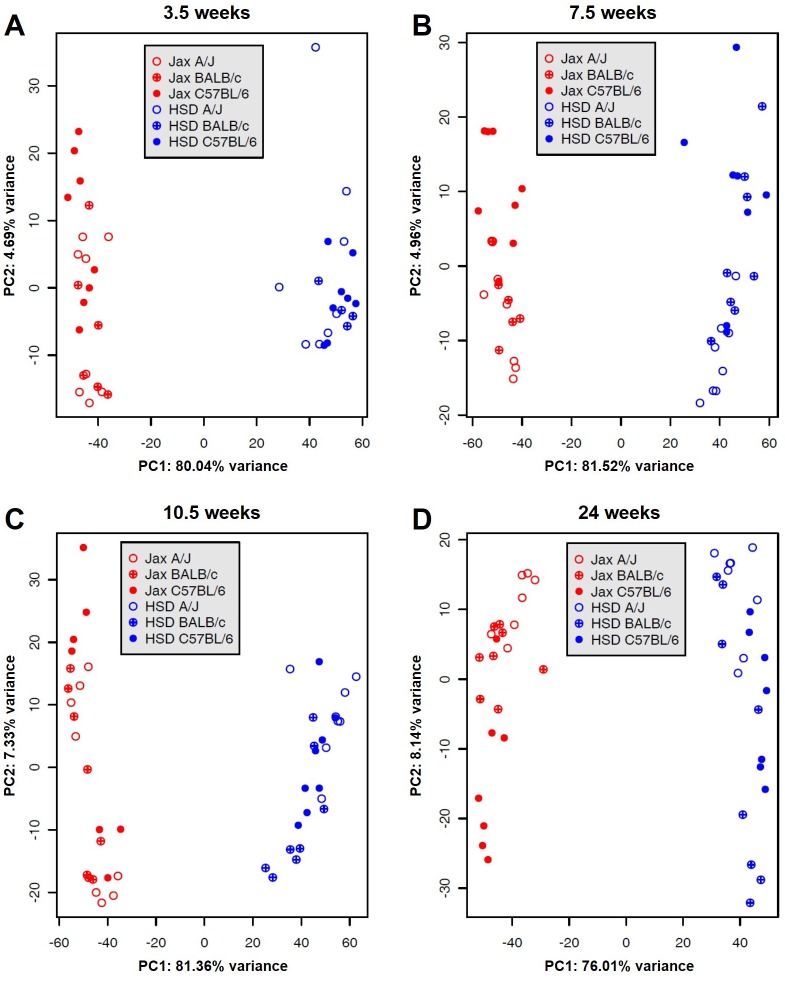
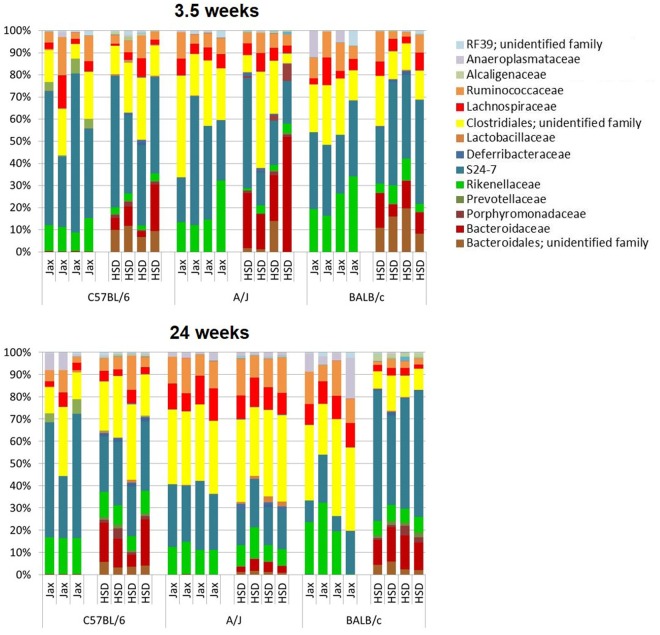
The commensal gut microbiota has been implicated as a determinant in several human diseases and conditions. There is mounting evidence that the gut microbiota of laboratory mice (Mus musculus) similarly modulates the phenotype of mouse models used to study human disease and development. While differing model phenotypes have been reported using mice purchased from different vendors, the composition and uniformity of the fecal microbiota in mice of various genetic backgrounds from different vendors is unclear. Using culture-independent methods and robust statistical analysis, we demonstrate significant differences in the richness and diversity of fecal microbial populations in mice purchased from two large commercial vendors. Moreover, the abundance of many operational taxonomic units, often identified to the species level, as well as several higher taxa, differed in vendor- and strain-dependent manners. Such differences were evident in the fecal microbiota of weanling mice and persisted throughout the study, to twenty-four weeks of age. These data provide the first in-depth analysis of the developmental trajectory of the fecal microbiota in mice from different vendors, and a starting point from which researchers may be able to refine animal models affected by differences in the gut microbiota and thus possibly reduce the number of animals required to perform studies with sufficient statistical power.


Conflict of interest statement

Competing Interests: The authors have declared that no competing interests exist.

Figures

Fig 1
Fig 1. Rarefaction of sequencing data.
Rarefaction analysis comparing the number of detected features to the total number of sequences obtained for each individual sample at 3.5 (A), 7.5 (B), 10.5 (C), and 24 weeks (D) of age. Data points are colored to indicate vendor and strain: Harlan, blue; Jackson, red; A/J, open; BALB/c, cross-hatched; C57BL/6, solid. Linear equations for mice from each vendor are shown, with depth in units of 10K reads.
Fig 2
Fig 2. Diversity of fecal microbiota.
Chao1 and Shannon estimates of microbial diversity plotted by time point (A) or by mouse strain (B). Bars on Chao1 estimates represent 95% confidence intervals. Data points are colored to indicate vendor Harlan (HSD), blue; Jackson (Jax), red.
Fig 3
Fig 3. Principal component analysis.
Principal component analysis of the gut microbiota in 3.5 (A), 7.5 (B), 10.5 (C), and 24 (D) week-old A/J, BALB/c, and C57BL/6 mice purchased from Harlan Laboratories or The Jackson Laboratory. Data points are colored to indicate vendor and strain: Harlan, blue; Jackson, red; A/J, open; BALB/c, cross-hatched; C57BL/6, solid.
Fig 4
Fig 4. Hierarchical cluster analysis of weanling mice.
Hierarchical cluster analysis of the 58 consistently detected operational taxonomic units (OTUs) in the gut microbiota of 3.5 week-old A/J, BALB/c, and C57BL/6 mice from Harlan Laboratories (HSD) and The Jackson Laboratory (Jax). Color intensity shows log2-transformed normalized abundance of OTUs in each sample. Color-coded bars at top indicate in ascending order: vendor, strain, and breeding room in vendor facility (legend at right). Zoom feature may be used to better visualize identity of OTUs.
Fig 5
Fig 5. Hierarchical cluster analysis of adult mice.
Hierarchical cluster analysis of the 58 consistently detected operational taxonomic units (OTUs) in the gut microbiota of 24 week-old A/J, BALB/c, and C57BL/6 mice from Harlan Laboratories (HSD) and The Jackson Laboratory (Jax). Color intensity shows log2-transformed normalized abundance of OTUs in each sample. Color-coded bars at top indicate in ascending order: vendor, strain, and breeding room in vendor facility (legend at right). Zoom feature may be used to better visualize identity of OTUs.
Fig 6
Fig 6. Relative abundance at taxonomic level of family.
Bar charts showing the bacterial composition of the same 3.5 and 24 week old C57BL/6, A/J, and BALB/c mice purchased from Harlan Laboratories (HSD) and The Jackson Laboratory (Jax), annotated to the taxonomic level of family. Legend of prominent families is shown at right.

References

    1. Metzker ML. Sequencing technologies—the next generation. Nature reviews Genetics. 2010;11(1): 31–46. 10.1038/nrg2626 - DOI - PubMed
    1. Sekirov I, Russell SL, Antunes LC, Finlay BB. Gut microbiota in health and disease. Physiological reviews. 2010;90(3): 859–904. 10.1152/physrev.00045.2009 - DOI - PubMed
    1. de Vos WM, de Vos EA. Role of the intestinal microbiome in health and disease: from correlation to causation. Nutrition reviews. 2012;70 Suppl 1: S45–56. 10.1111/j.1753-4887.2012.00505.x - DOI - PubMed
    1. Collins FS, Tabak LA. Policy: NIH plans to enhance reproducibility. Nature. 2014;505(7485): 612–613. - PMC - PubMed
    1. Perrin S. Preclinical research: Make mouse studies work. Nature. 2014;507(7493): 423–425. - PubMed

Publication types

Substances

Associated data