Review
. 2015 Apr;36(2):149-73.
doi: 10.1210/er.2014-1063. Epub 2015 Feb 12.

Glucose homeostasis during short-term and prolonged exposure to high altitudes

Affiliations
Review

Glucose homeostasis during short-term and prolonged exposure to high altitudes

Orison O Woolcott et al. Endocr Rev. 2015 Apr.

Abstract

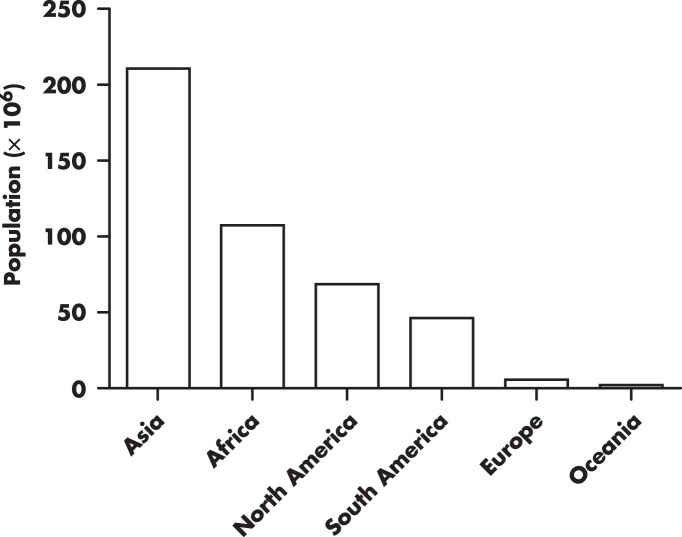
Most of the literature related to high altitude medicine is devoted to the short-term effects of high-altitude exposure on human physiology. However, long-term effects of living at high altitudes may be more important in relation to human disease because more than 400 million people worldwide reside above 1500 m. Interestingly, individuals living at higher altitudes have a lower fasting glycemia and better glucose tolerance compared with those who live near sea level. There is also emerging evidence of the lower prevalence of both obesity and diabetes at higher altitudes. The mechanisms underlying improved glucose control at higher altitudes remain unclear. In this review, we present the most current evidence about glucose homeostasis in residents living above 1500 m and discuss possible mechanisms that could explain the lower fasting glycemia and lower prevalence of obesity and diabetes in this population. Understanding the mechanisms that regulate and maintain the lower fasting glycemia in individuals who live at higher altitudes could lead to new therapeutics for impaired glucose homeostasis.


Figures

Figure 1.
Figure 1.. Number of people worldwide living above 1500 m estimated for the year 2000.
Adapted from the Center for International Earth Science Information Network (8).
Figure 2.
Figure 2.. Glycemia profile during an iv insulin tolerance test performed at 150 m (normobaric normoxia) and after acute exposure to simulated altitude (hypobaric hypoxia) at 3200 m.
Male subjects (BMI, 26 ± 3.53 kg/m2 [mean ± SD]) were in an approximately 15-hour fasting state before the commencement of the test (O. Woolcott, unpublished data). *, P < .01; **, P < .001; ***, P < .05, hypobaric hypoxia vs normobaric normoxia.
Figure 3.
Figure 3.. Differences in fasting venous glycemia in response to short and prolonged exposure to high altitudes in nondiabetic humans.
Plots were created by using reported glycemia values from studies conducted in lowlanders exposed for short (1–9 d) (21, 22, 24, 25, 27, 28, 264–266) and prolonged (10–90 d) (23, 24, 26, 28, 32–35) periods to high altitude and very high altitude, under simulated (hypobaria and hypoxia) or natural conditions. Columns and bars are medians and interquartile ranges, respectively.
Figure 4.
Figure 4.. Differences in fasting venous glycemia from humans living at low altitudes compared with those living at high altitudes.
Figure was generated using reported values from studies that measured plasma glucose (38, 41–43, 45, 46, 75) and whole-blood glucose (26, 40, 41, 43, 123). Columns and bars are medians and interquartile ranges, respectively.
Figure 5.
Figure 5.. Intravenous glucose tolerance test in subjects residing at 4540 m (n = 7) and subjects residing at 150 m (n = 8) above sea level.
Figure was created using available data from Ref. , including only subjects with lean BMI (<25 kg/m2). Note the pronounced and faster decrease of glycemia in the higher altitude group after glucose administration (at min 0). Symbols and bars represent mean and SE values, respectively. *, P < .05; **, P < .01.
Figure 6.
Figure 6.. Hypothetical variability of fasting glycemia in nondiabetic humans exposed to natural high or very high altitude.
It is possible that the variability of glycemia could also be related to the magnitude of the elevation, with more pronounced changes in glycemia (lowering effect) and faster shifts at higher altitudes. However, this is still speculative. Definitions of acute, subacute, and chronic terms are arbitrary. See Introduction for explanation.
Figure 7.
Figure 7.. Hypothetical schematic to explain the lower fasting glycemia in healthy individuals living at higher altitudes.
The lower fasting glycemia occurs despite similar or lower fasting insulin values as compared to lowlanders (40, 41, 45, 47, 48). In the fasting state, the liver is responsible for maintaining relatively constant the fasting glycemia, contributing up to 80% of the total endogenous glucose production (83). Moreover, there is evidence of a more rapid glucose disposal in highlanders after iv glucose administration (42, 46, 122). Based on these findings, and the evidence of increased skeletal glucose uptake in response to anoxia/hypoxia (116, 144–151, 153), we propose that in the highlander, a lower hepatic glucose output (open blue arrow) and a higher glucose disposal in the skeletal muscle (and probably in the adipose tissue) (solid blue arrows) may account for the lower fasting glycemia as compared with the lowlander (black arrows). For clarity purposes, the substantial fraction of glucose disposal in the liver and kidneys (259, 267) is not represented in the scheme. GI, gastrointestinal tract.
Figure 8.
Figure 8.. Factors linked to obesity and diabetes.
Although nonenvironmental factors have been shown to have a stronger association with obesity and diabetes, several studies have confirmed a link between environmental factors and these clinical conditions. Among these factors, geographical elevation has been associated with lower prevalence of obesity and diabetes, independent of several other potential factors (208, 213, 222).

References

    1. West JB. The physiologic basis of high-altitude diseases. Ann Intern Med. 2004;141:789–800. - PubMed
    1. Beall CM. Adaptations to altitude: a current assessment. Annu Rev Anthropol. 2001;30:423–456.
    1. Weil JV, Zwillich CW. Assessment of ventilatory response to hypoxia: methods and interpretation. Chest. 1976;70:124–128. - PubMed
    1. Peacock AJ. ABC of oxygen: oxygen at high altitude. BMJ. 1998;317:1063–1066. - PMC - PubMed
    1. Blume FD. Metabolic and endocrine changes at altitude. In: West JB, Lahiri S, eds. High Altitude and Man. Bethesda, MD: American Physiological Society; 1984:37–45.

LinkOut - more resources