. 2015 Mar;10(3):442-58.
doi: 10.1038/nprot.2014.191. Epub 2015 Feb 12.

Fluorescent in situ sequencing (FISSEQ) of RNA for gene expression profiling in intact cells and tissues

Affiliations

Fluorescent in situ sequencing (FISSEQ) of RNA for gene expression profiling in intact cells and tissues

Je Hyuk Lee et al. Nat Protoc. 2015 Mar.

Abstract

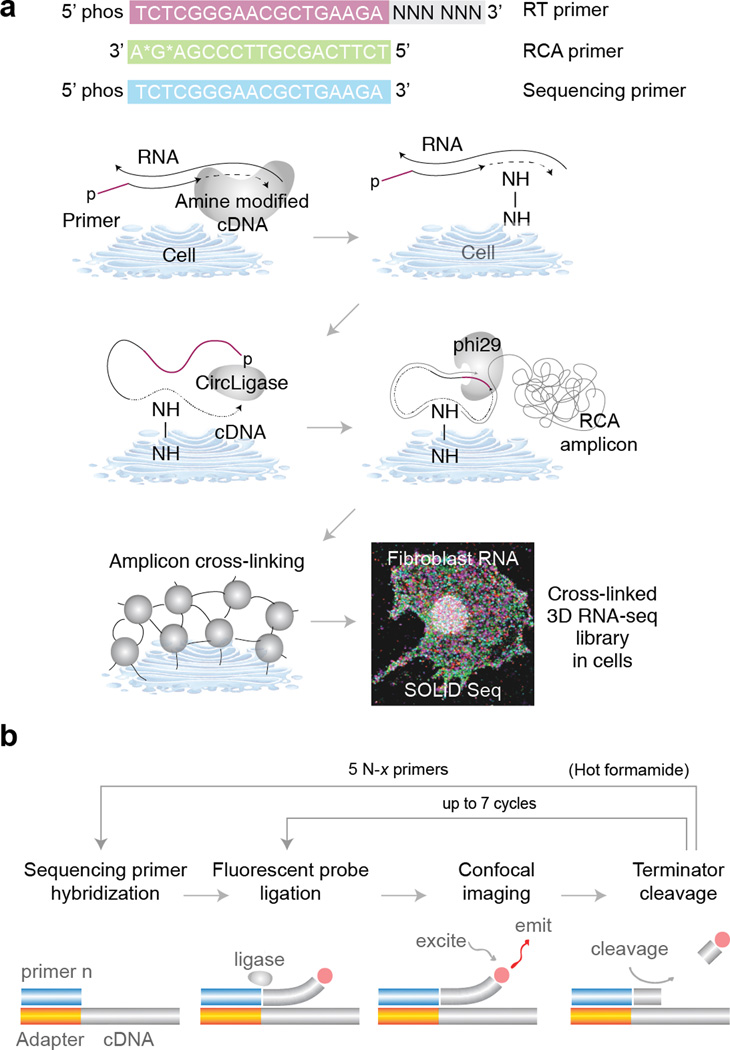
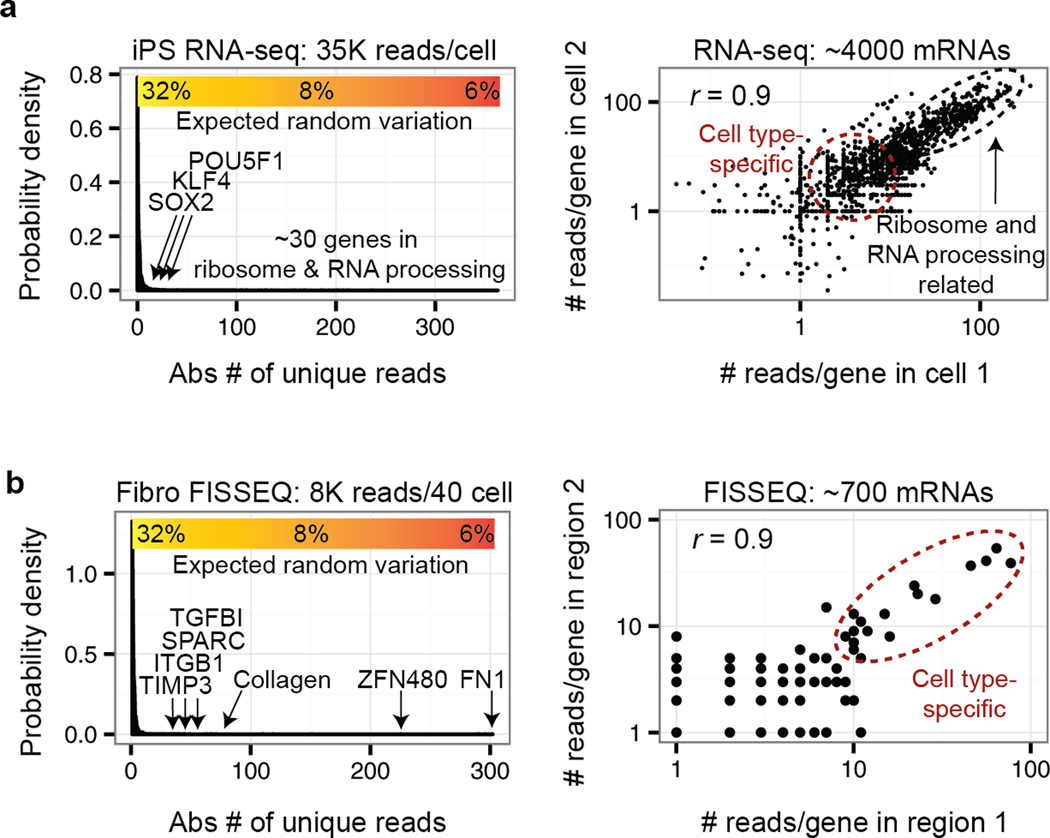
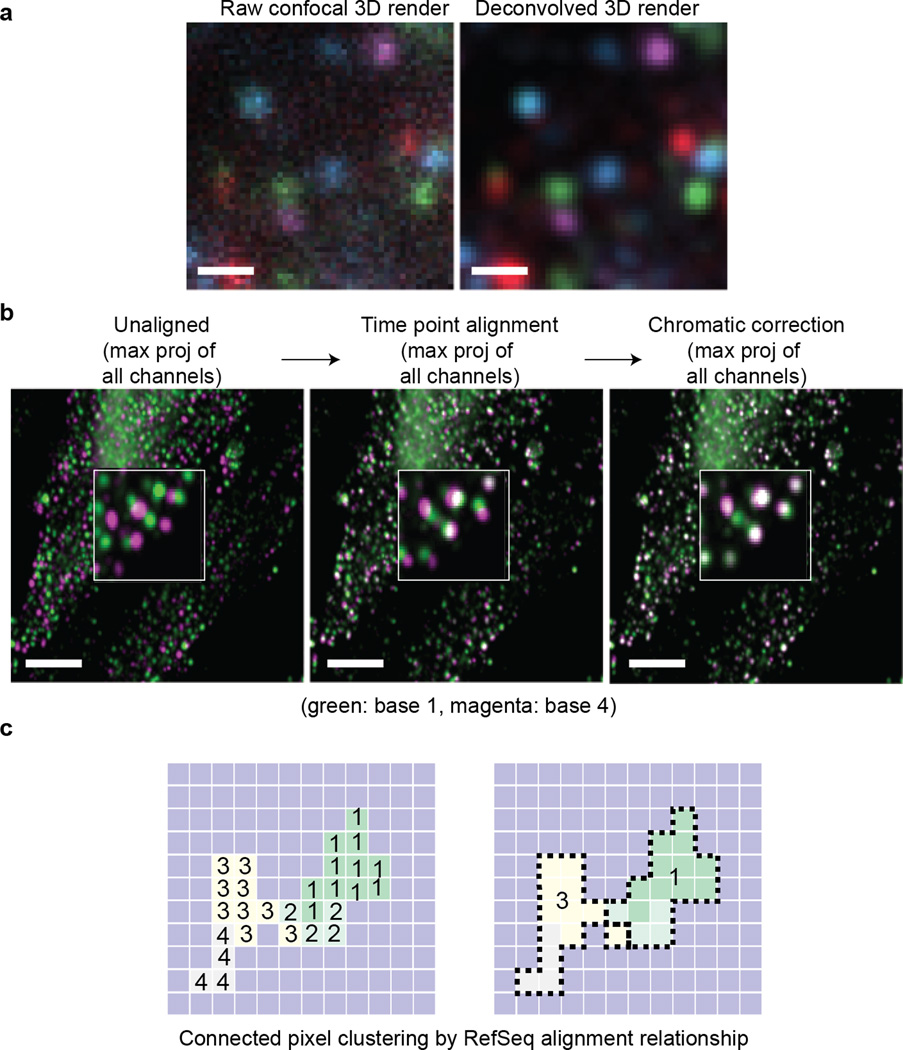
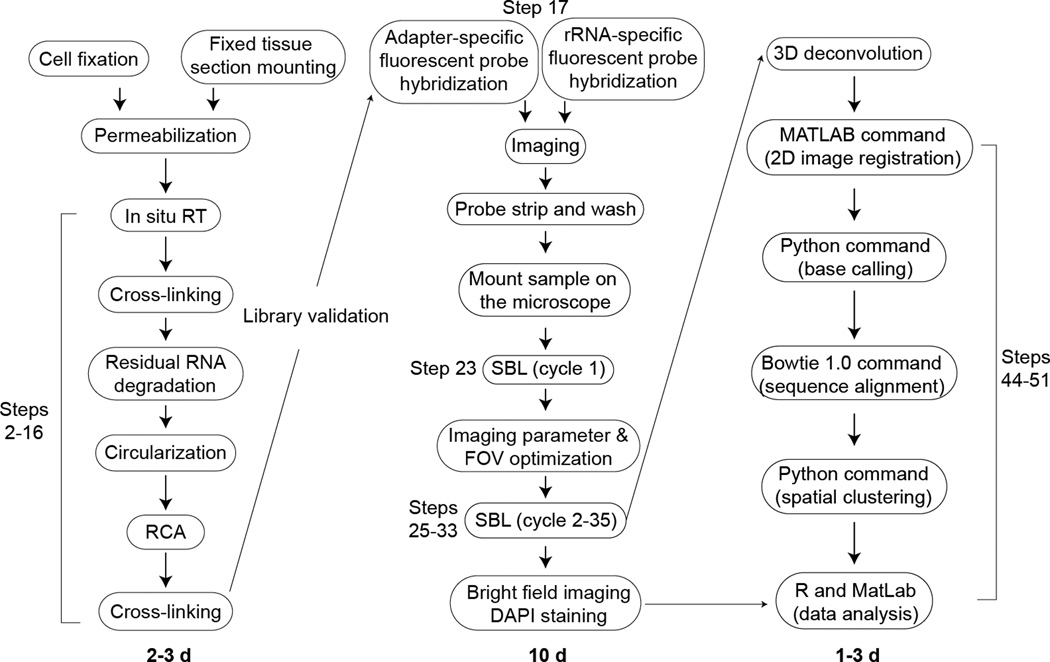
RNA-sequencing (RNA-seq) measures the quantitative change in gene expression over the whole transcriptome, but it lacks spatial context. In contrast, in situ hybridization provides the location of gene expression, but only for a small number of genes. Here we detail a protocol for genome-wide profiling of gene expression in situ in fixed cells and tissues, in which RNA is converted into cross-linked cDNA amplicons and sequenced manually on a confocal microscope. Unlike traditional RNA-seq, our method enriches for context-specific transcripts over housekeeping and/or structural RNA, and it preserves the tissue architecture for RNA localization studies. Our protocol is written for researchers experienced in cell microscopy with minimal computing skills. Library construction and sequencing can be completed within 14 d, with image analysis requiring an additional 2 d.


Conflict of interest statement

Competing financial interests

Potential conflicts of interests for G.M.C. are listed on http://arep.med.harvard.edu/gmc/tech.html. Other authors have no conflicts of interests.

Figures

Figure 1
Figure 1
Schematic overview of FISSEQ library construction and sequencing. (a) Fixed cells or tissues are permeabilized and reverse transcribed in situ in the presence of aminoallyl dUTP and adapter sequence-tagged random hexamers. The cDNA fragments are fixed to the cellular protein matrix using a non-reversible amine cross-linker and circularized after degrading the RNA. The circular templates are amplified using RCA primers complementary to the adapter sequence in the presence of aminoallyl dUTP and stably cross-linked. The nucleic acid amplicons in cells are then ready for sequencing and imaging (fibroblast shown). (b) Each amplicon contains numerous tandem copies of the cDNA template and adapter sequence. A sequencing primer hybridizes to the adapter sequences in individual amplicons, and fluorescent eight base probes interrogate the adjacent dinucleotide pair. After imaging, the three bases attached to a fluorophore are cleaved, generating a phosphorylated 5’ end at the ligation complex suitable for additional ligation cycles interrogating every fifth dinucleotide pairs. The whole process is repeated using four other sequencing primers with an offset to interrogate intervening base positions.
Figure 2
Figure 2
Comparing single cell RNA-seq to FISSEQ. (a) A typical single cell RNA-seq can generate >1 million reads per cell, but less than 10% represent unique reads from cDNAs, and they are comprised largely of structural and/or house-keeping genes (i.e. ribosome-related). Many genes of interest are found near the detection limit with a large coefficient of variation (CV), and the high correlation reported for single cell RNA-seq is typically due to house-keeping genes. (b) The current version of FISSEQ combines mRNA reads from ~40 cells to obtain a comparable result, but the high correlation between biological replicates in FISSEQ results from mostly cell type-specific expression markers.
Figure 3
Figure 3
Counting resolution-limited amplicons using partition sequencing. (a) The cDNA or padlock probe template can include 3 random nucleotides in equal proportions. By controlling the length of the complementary portion of the sequencing primer to the random bases, one can ligate fluorescent probes to different amplicon pools of varying sizes (fibroblasts; bar: 1 µm). This scheme works for single-base sequencing-by-ligation, and the SOLiD sequencing chemistry requires additional modifications to the bridge oligonucleotide. (b) Serial ligation reactions using the sequencing primers with 0 to 3 complementary bases to the random partitioning bases are analogous to doing a serial dilution experiment. The average count from each primer category can be used to extrapolate and estimate the actual amplicon count, regardless of the limitations in optical microscopy.
Figure 4
Figure 4
Schematic overview of the SOLiD color coding and decoding scheme. (a) The base position within the template sequence is enclosed by white circles and should be used for naming the image files, and the actual sequencing cycle numbers are noted on both sides. Each ligation extension is shown in different colors, and cycle 15, 22 and 29 are shown in gray as no images are acquired for these cycles. The red box at cycle 8 denotes a known base identity. (b) SOLiD dinucleotide coding scheme. (c) SOLiD color space decoding scheme (figures modified from the Life Technologies application note). As long as any one of the base identities are known (here in red), the color space sequence can be converted to the nucleotide sequence.
Figure 5
Figure 5
Example of image analysis, registration and sequence clustering. (a) A four color confocal image stack is deconvolved using a CLME algorithm with 10 iterations and a signal-to-noise ratio of two (bar: 1 µm). (b) Sequencing images for base 1 and base 4 (left) are aligned using a composite channel across various time points (middle) and then using a composite time projection across various channels (right) (bar: 5 µm). (c) Individual non-zero pixels are aligned to the reference sequence database (i.e. human RefSeq). Highly related sequences connected to the neighboring pixels are then grouped into a single cluster.
Figure 6
Figure 6
Schematic overview of FISSEQ experimental and analysis steps.

Similar articles

Cited by

References

    1. Rifai N, Gillette MA, Carr SA. Protein biomarker discovery and validation: the long and uncertain path to clinical utility. Nat Biotechnol. 2006;24:971–983. - PubMed
    1. Jaitin DA, et al. Massively parallel single-cell RNA-seq for marker-free decomposition of tissues into cell types. Science. 2014;343:776–779. - PMC - PubMed
    1. Battich N, Stoeger T, Pelkmans L. Image-based transcriptomics in thousands of single human cells at single-molecule resolution. Nat Methods. 2013 - PubMed
    1. Lein ES, et al. Genome-wide atlas of gene expression in the adult mouse brain. Nature. 2007;445:168–176. - PubMed
    1. Zeng H, et al. Large-scale cellular-resolution gene profiling in human neocortex reveals species-specific molecular signatures. Cell. 2012;149:483–496. - PMC - PubMed

Publication types

MeSH terms