. 2015 Feb 12;9(2):e0003520.
doi: 10.1371/journal.pntd.0003520. eCollection 2015 Feb.

CD8+ T lymphocyte expansion, proliferation and activation in dengue fever

Affiliations

CD8+ T lymphocyte expansion, proliferation and activation in dengue fever

Andréia Manso de Matos et al. PLoS Negl Trop Dis. .

Abstract

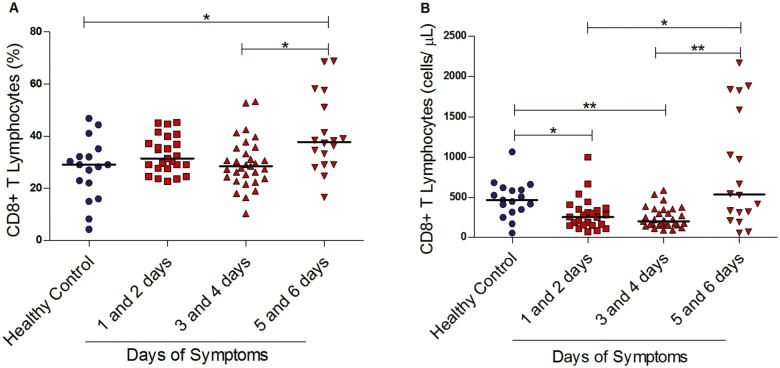
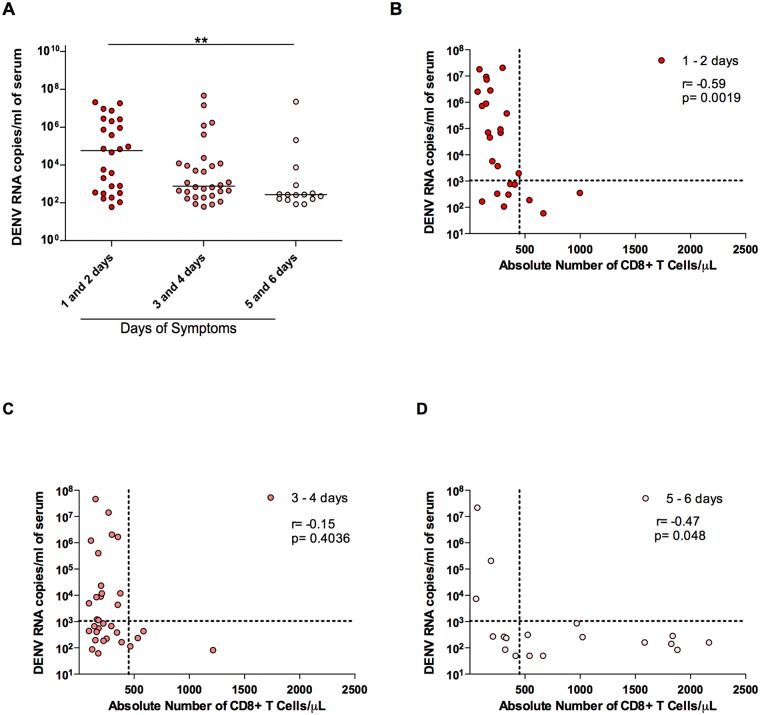
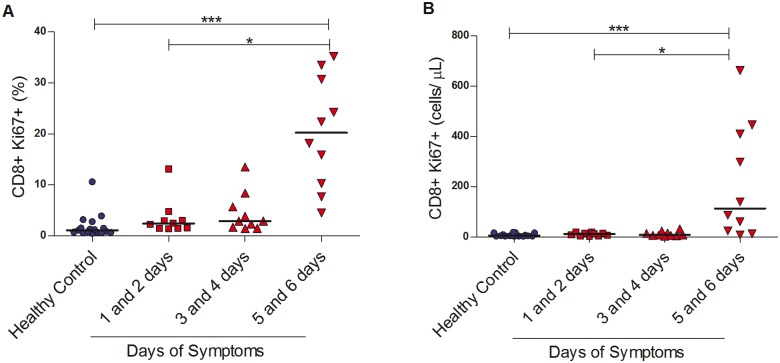
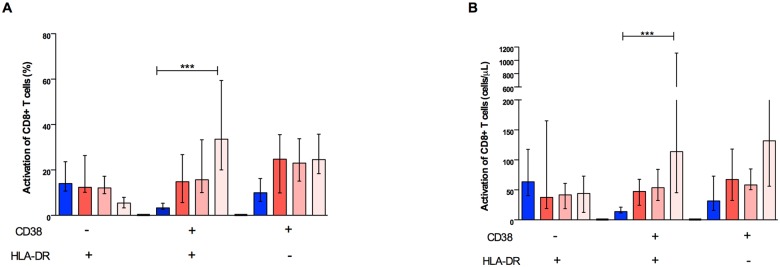
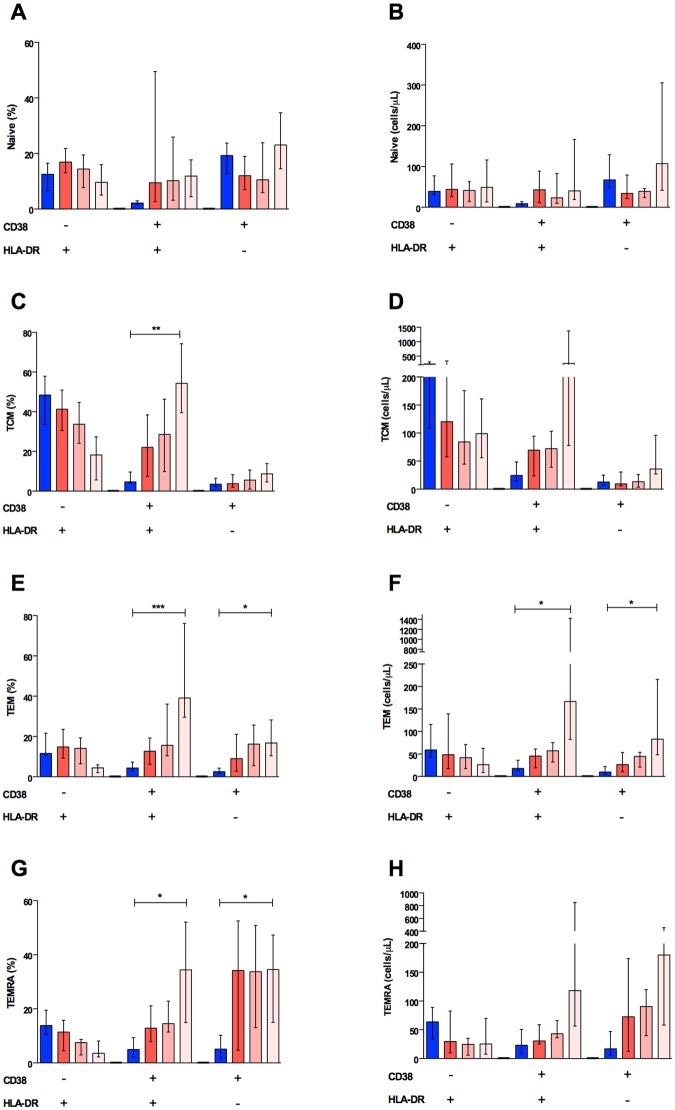
Dengue fever induces a robust immune response, including massive T cell activation. The level of T cell activation may, however, be associated with more severe disease. In this study, we explored the level of CD8+ T lymphocyte activation in the first six days after onset of symptoms during a DENV2 outbreak in early 2010 on the coast of São Paulo State, Brazil. Using flow cytometry we detected a progressive increase in the percentage of CD8+ T cells in 74 dengue fever cases. Peripheral blood mononuclear cells from 30 cases were thawed and evaluated using expanded phenotyping. The expansion of the CD8+ T cells was coupled with increased Ki67 expression. Cell activation was observed later in the course of disease, as determined by the expression of the activation markers CD38 and HLA-DR. This increased CD8+ T lymphocyte activation was observed in all memory subsets, but was more pronounced in the effector memory subset, as defined by higher CD38 expression. Our results show that most CD8+ T cell subsets are expanded during DENV2 infection and that the effector memory subset is the predominantly affected sub population.


Conflict of interest statement

The authors have declared that no competing interests exist.

Figures

Fig 1
Fig 1. CD8+ T lymphocytes in the course of dengue fever.
(A) Percentage within T cells and (B) absolute numbers of CD8+ T lymphocytes in the peripheral blood from healthy controls (n = 17) and dengue fever patients at different days of symptoms (n = 74). A significant change in the percentage of CD8+ T lymphocytes was observed, between days 5 and 6 after the onset of symptoms when compared to healthy controls and days 3 and 4 of symptoms, as shown in A. However, decreased absolute CD8+ T lymphocyte numbers were documented in the first four days of symptoms when compared to healthy controls, returning to higher levels later in the disease’s course, as shown in B. *p< 0.05, ** p<0.01.
Fig 2
Fig 2. Correlation of CD8+ T lymphocyte numbers and DENV viral load.
In A, viral load was determined on different days of symptoms and a significant decrease was observed in days 5 and 6 when compared to days 1 and 2 after the onset of symptoms (p value = 0.0136). In B, a negative correlation was observed between 1 and 2 days of symptoms (r = -0.5900, p = 0.0019). There is no correlation between 3 and 4 days of symptoms (C) and viral loads; In D, a negative correlation was observed between viral loads and 5 and 6 days of symptoms (r = - 0.4705, p = 0.0488). Dashed lines are arbitrarily set at 450 CD8+ T lymphocytes/μL and 1050 copies of RNA/ml.
Fig 3
Fig 3. Proliferation of CD8+ T lymphocytes in dengue fever.
(A) Percentage and (B) absolute numbers of Ki67+ within CD8+ T lymphocytes in the peripheral blood from healthy controls (n = 17) and dengue fever patients (n = 74) at different days of symptoms. *p<0.05, ***p<0.0001.
Fig 4
Fig 4. Activation of CD8+ T cells in dengue fever.
(A) Percentage and (B) absolute numbers of three subpopulations (HLADR+, CD38+HLADR+, and CD38+) within CD8+ T cells in the peripheral blood from healthy controls (n = 17) and dengue fever patients (n = 74) at different days of symptoms: HLADR+, CD38+HLADR+, and CD38+. Only the dual positive subpopulation significantly increased during the course of dengue fever, either in their percentage or absolute numbers. *p< 0.05, ***p< 0.0001.
Fig 5
Fig 5. Activation of CD8+ T cells subpopulations in dengue fever.
Percentage and absolute numbers of naïve (A and B), central memory (C and D), effector memory (E and F), and terminal effector memory (G and H) T CD8+ cells are shown. Increased percentages of activated cells were observed mostly in dual positive CD38+HLA-DR+ central memory (TCM) (p<0.001) effector memory (TEM) (p<0.0001) and terminal effector memory (TEMRA) (p<0.01) T cells, although the percentage of CD38+HLA-DR- effector memory (p<0.01) and terminal effector (p<0.01) T cells were also augmented in dengue fever.

References

    1. Bhatt S, Gething PW, Brady OJ, Messina JP, Farlow AW, et al. (2013) The global distribution and burden of dengue. Nature 496: 504–507. 10.1038/nature12060 - DOI - PMC - PubMed
    1. PAHO (2008) Number of Reported Cases of Dengue and Dengue Hemorrhagic Fever (DHF), Region of the Americas (by country and subregion). Pan American Health Society.
    1. Messer W, Vitarana U, Sivananthan K, Elvtigala J, Preethimala L, et al. (2002) Epidemiology of dengue in Sri Lanka before and after the emergence of epidemic dengue hemorrhagic fever. Am J Trop Med Hyg 66: 765–773. - PubMed
    1. Malavige G, Fernando S, Fernando D, Seneviratne S (2004) Dengue viral infections. Postgrad Med J 80: 588–601. - PMC - PubMed
    1. Halstead S (1988) Pathogenesis of dengue: challenges to molecular biology. Science 239: 476–481. - PubMed

Publication types

MeSH terms