. 2015 Feb 24;112(8):2314-9.
doi: 10.1073/pnas.1413003112. Epub 2015 Feb 9.

Simultaneous cryo X-ray ptychographic and fluorescence microscopy of green algae

Affiliations

Simultaneous cryo X-ray ptychographic and fluorescence microscopy of green algae

Junjing Deng et al. Proc Natl Acad Sci U S A. .

Abstract

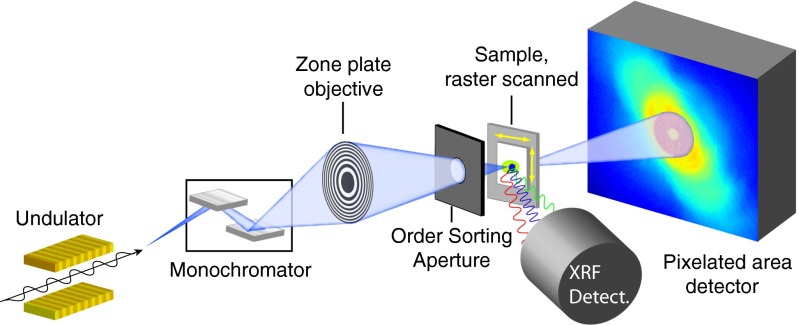
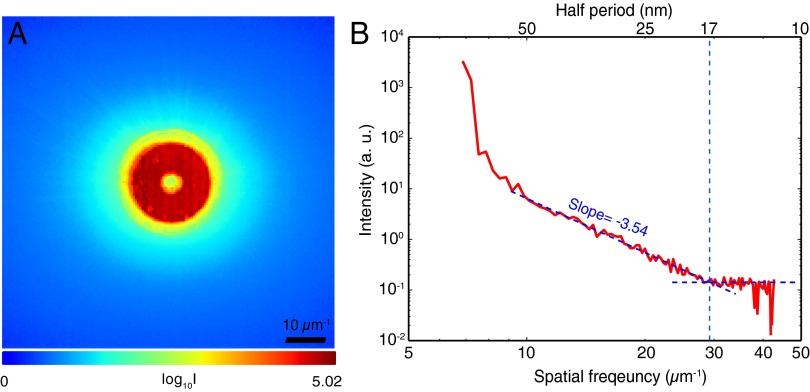
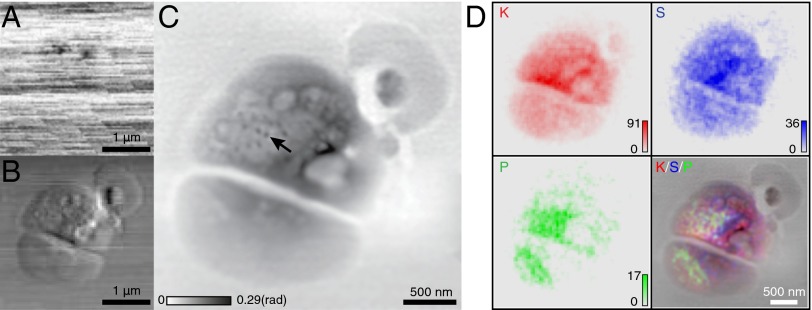
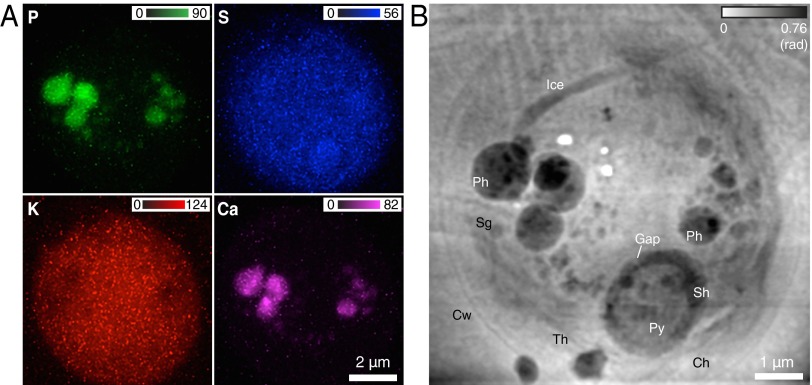
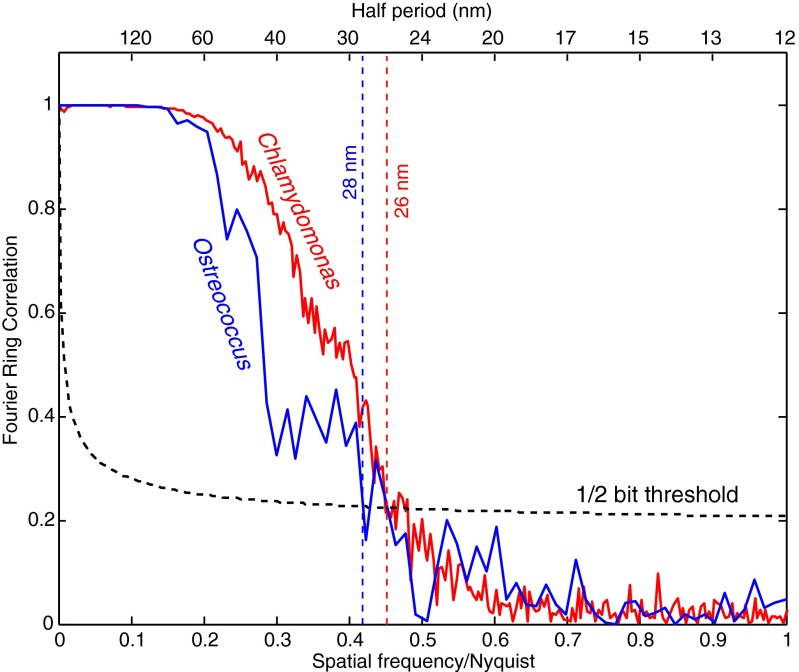
Trace metals play important roles in normal and in disease-causing biological functions. X-ray fluorescence microscopy reveals trace elements with no dependence on binding affinities (unlike with visible light fluorophores) and with improved sensitivity relative to electron probes. However, X-ray fluorescence is not very sensitive for showing the light elements that comprise the majority of cellular material. Here we show that X-ray ptychography can be combined with fluorescence to image both cellular structure and trace element distribution in frozen-hydrated cells at cryogenic temperatures, with high structural and chemical fidelity. Ptychographic reconstruction algorithms deliver phase and absorption contrast images at a resolution beyond that of the illuminating lens or beam size. Using 5.2-keV X-rays, we have obtained sub-30-nm resolution structural images and ∼90-nm-resolution fluorescence images of several elements in frozen-hydrated green algae. This combined approach offers a way to study the role of trace elements in their structural context.

Keywords: X-ray fluorescence microscopy; cryogenic biological samples; ptychography.


Conflict of interest statement

The authors declare no conflict of interest.

Figures

Fig. 1.
Fig. 1.
Schematic of the experimental layout of combined cryogenic fluorescence and ptychographic imaging. A cryogenic sample is raster-scanned through a focused X-ray beam; at each scan position, an energy-dispersive detector records the X-ray fluorescence spectrum from the sample, whereas a pixelated area detector records the far-field diffraction pattern.
Fig. 2.
Fig. 2.
View of the ptychographic data produced by X-ray diffraction from a frozen-hydrated Ostreococcus alga, acquired at 5.2-keV photon energy. (A) The average (logarithmic scale) of 4,000 far-field diffraction pattern recordings from the cell region within the 100 × 100-point scan; the high-intensity red annulus represents the incident beam focused by a Fresnel zone plate with a central stop, whereas the light blue areas represent significant scattering from the cell (the speckles of individual diffraction patterns are not visible in this summed image). By subtracting the diffraction pattern measured with no sample present, and carrying out an azimuthal average, one arrives at B, which is a plot of diffraction from the alga as a function of spatial frequency f. The diffraction intensity signal S decreases as Sf3.54 until, at a length scale with a half-period of about 17 nm, it reaches a flat region consistent with spatially uncorrelated noise fluctuations.
Fig. 3.
Fig. 3.
Images of a frozen-hydrated Ostreococcus alga obtained from 100 × 100-point scan data. (A) Absorption contrast image of the alga, obtained from the total signal recorded on the pixelated area detector at each scan point. (B) Differential phase contrast image in the horizontal direction, obtained by plotting the first moment of the diffraction patterns as a function of position. (C) Phase of the sample complex transmission function reconstructed via ptychography. The arrow points to structures that resemble ribosome-like complexes observed in cryo electron microscopy studies of similar algae (46). (D) X-ray fluorescence maps of the distributions of the elements K, S, and P, along with their color-composite overlay on the ptychographic image C. For the fluorescence images, the numbers of X-ray photons recorded per pixel dwell time are shown as “counts.” The presence of K within the cell suggests good preservation of membrane integrity in the frozen-hydrated sample preparation.
Fig. 4.
Fig. 4.
Fluorescence maps and ptychographic image of a frozen-hydrated C. reinhardtii alga obtained from 167 × 151-point scan data. (A) Elemental distributions of P, S, K, and Ca within the cell. (B) Phase image reconstructed via ptychography. A number of organelles can be identified inside the cell wall (Cw): polyphosphate bodies (Ph), pyrenoid (Py), thylakoids (Th), chloroplast (Ch), starch granule (Sg), and starch sheath (Sh). Some ice changes can be seen in the top half of the cell due to a malfunction of a cryogenic component during the second half of the scan (Materials and Methods). One can also see three white spots where, due to glitches in the scan control, the X-ray beam was allowed to dwell for a long time, thus leading to “beam burn,” which has been observed before in frozen-hydrated specimens at cryogenic temperatures (see, e.g., figure 8 of ref. 30).
Fig. 5.
Fig. 5.
Resolution estimation of the ptychographic phase images of Ostreococcus (Fig. 3) and Chlamydomonas (Fig. 4) by FRC. In each case, the overlapping beam spot data were divided into two separate sets, with each set reconstructed to yield two images of the same object from independent data. This approach leads to lower resolution images than one obtains by using the full dataset, but it provides a conservative estimate of the spatial resolution. FRC measures the phase correlation of the Fourier transforms of the two images at various spatial frequency ranges, or length scales.

References

    1. Paunesku T, Vogt S, Maser J, Lai B, Woloschak G. X-ray fluorescence microprobe imaging in biology and medicine. J Cell Biochem. 2006;99(6):1489–1502. - PubMed
    1. Fahrni CJ. Biological applications of X-ray fluorescence microscopy: Exploring the subcellular topography and speciation of transition metals. Curr Opin Chem Biol. 2007;11(2):121–127. - PubMed
    1. Majumdar S, et al. Applications of synchrotron μ-XRF to study the distribution of biologically important elements in different environmental matrices: A review. Anal Chim Acta. 2012;755:1–16. - PubMed
    1. Krause M. Atomic radiative and radiationless yields for K and L shells. J Phys Chem Ref Data. 1979;8(2):307–327.
    1. Schmahl G, Rudolph D. In: Proposal for a Phase Contrast X-ray Microscope. Cheng PC, Jan GJ, editors. Springer; Berlin: 1987. pp. 231–238.

Publication types

MeSH terms

LinkOut - more resources