Clinical Trial
. 2015 Feb 24;112(8):2569-74.
doi: 10.1073/pnas.1417432112. Epub 2015 Feb 9.

Oxalic acid and diacylglycerol 36:3 are cross-species markers of sleep debt

Affiliations
Clinical Trial

Oxalic acid and diacylglycerol 36:3 are cross-species markers of sleep debt

Aalim M Weljie et al. Proc Natl Acad Sci U S A. .

Abstract

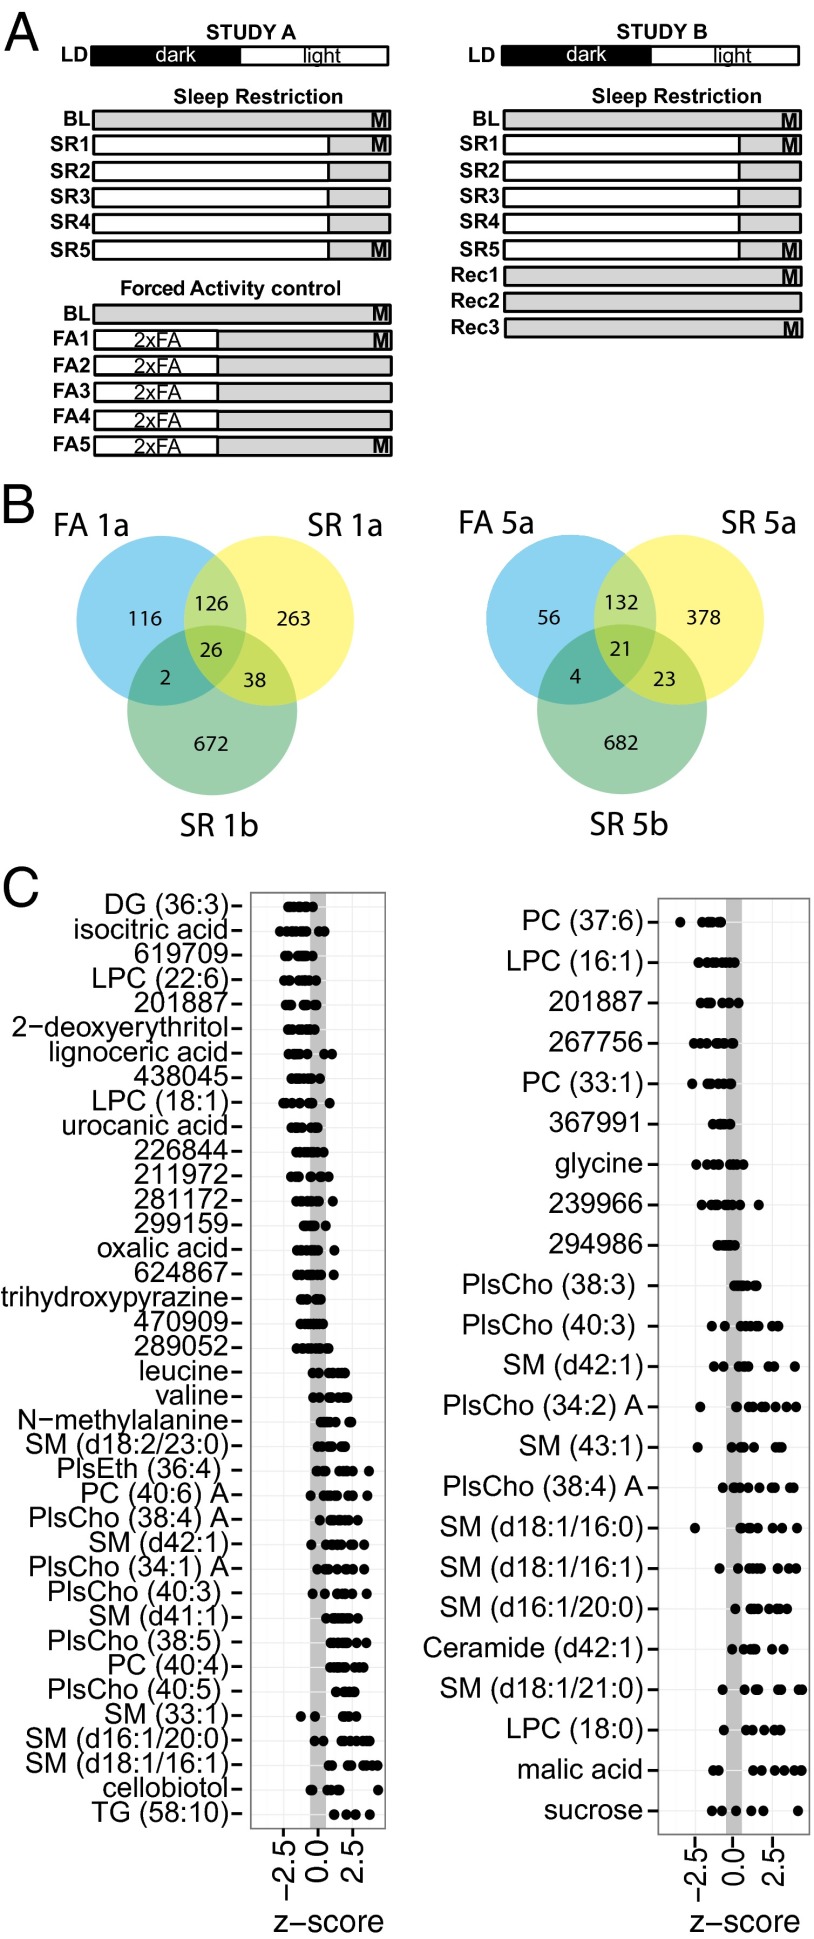
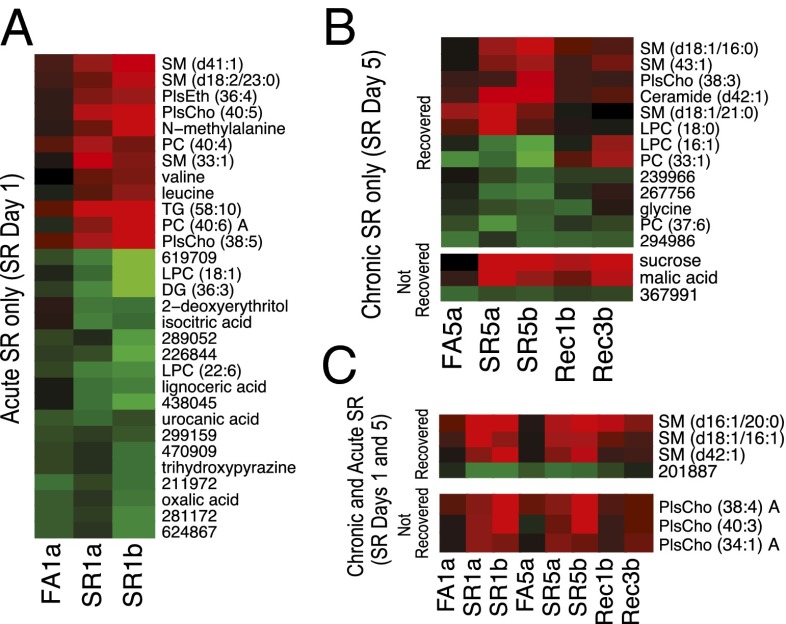
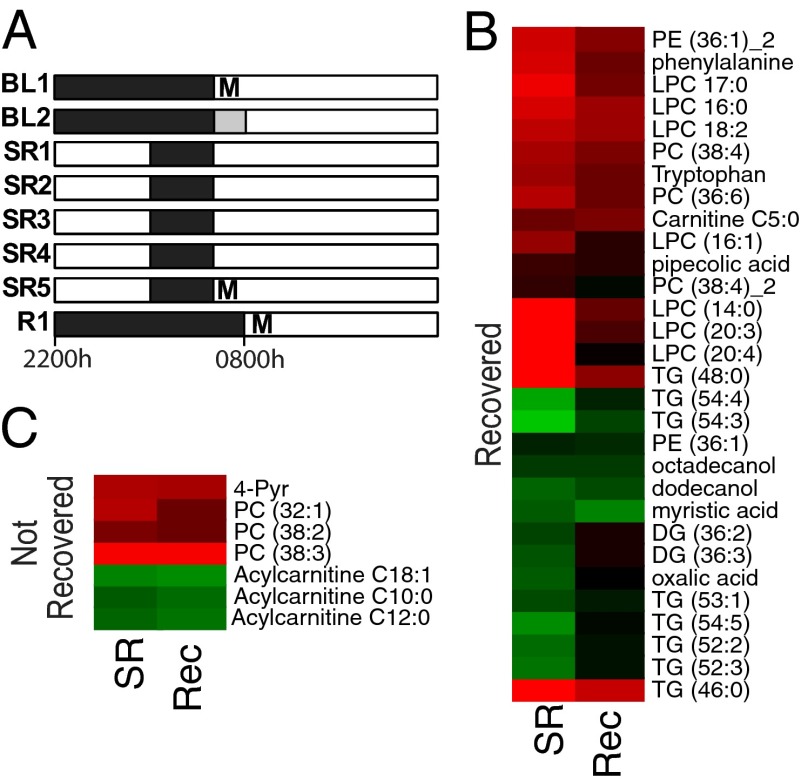
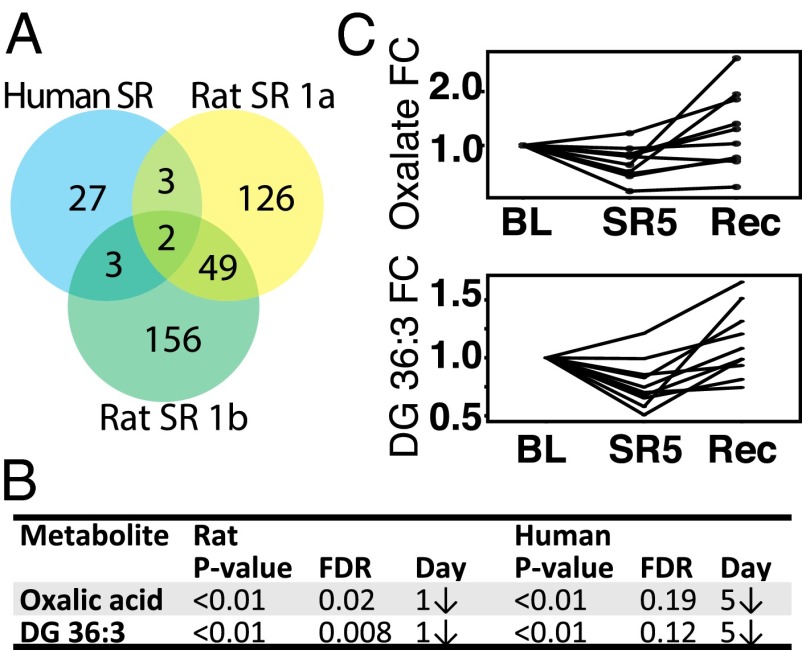
Sleep is an essential biological process that is thought to have a critical role in metabolic regulation. In humans, reduced sleep duration has been associated with risk for metabolic disorders, including weight gain, diabetes, obesity, and cardiovascular disease. However, our understanding of the molecular mechanisms underlying effects of sleep loss is only in its nascent stages. In this study we used rat and human models to simulate modern-day conditions of restricted sleep and addressed cross-species consequences via comprehensive metabolite profiling. Serum from sleep-restricted rats was analyzed using polar and nonpolar methods in two independent datasets (n = 10 per study, 3,380 measured features, 407 identified). A total of 38 features were changed across independent experiments, with the majority classified as lipids (18 from 28 identified). In a parallel human study, 92 metabolites were identified as potentially significant, with the majority also classified as lipids (32 of 37 identified). Intriguingly, two metabolites, oxalic acid and diacylglycerol 36:3, were robustly and quantitatively reduced in both species following sleep restriction, and recovered to near baseline levels after sleep restriction (P < 0.05, false-discovery rate < 0.2). Elevated phospholipids were also noted after sleep restriction in both species, as well as metabolites associated with an oxidizing environment. In addition, polar metabolites reflective of neurotransmitters, vitamin B3, and gut metabolism were elevated in sleep-restricted humans. These results are consistent with induction of peroxisome proliferator-activated receptors and disruptions of the circadian clock. The findings provide a potential link between known pathologies of reduced sleep duration and metabolic dysfunction, and potential biomarkers for sleep loss.

Keywords: lipidomics; mass spectrometry; metabolomics; sleep deprivation; sleep restriction.


Conflict of interest statement

The authors declare no conflict of interest.

Figures

Fig. 1.
Fig. 1.
Rat serum metabolite biomarker study design. (A) Animals in study A (Left) were subjected to SR by FA for 5 d (SR1–SR5) and a FA control group was subjected to FA for half the time at double speed (2xFA) for 5 d (FA1–FA5). White bars indicate periods of forced activity. Blood samples for metabolomics (M) were taken just before the end of the light phase on day 0 (baseline), day 1 (acute SR), and day 5 (chronic SR). Animals in study B (Right) were similarly SR, followed by 3 d of unrestricted recovery sleep (Rec1–Rec3). Samples were taken as in study A and at Rec1 (acute recovery), and Rec3 (extended recovery). (B) Overlap in metabolites noted as significantly different between acute SR and BL time points (Left) and chronic SR and BL time points (Right). FA denotes a forced activity control from study A. Suffix “a” or “b” denotes study A or study B, respectively. (C) Z-score plots of metabolites (ordered by mean change) that were significantly different between SR and BL time points in study A. A positive value denotes an elevated level under SR conditions. Numeric identifiers indicate unidentified metabolites, and details of their retention index and quantified m/z values are available in Table S1.
Fig. 2.
Fig. 2.
Metabolites perturbed by SR in the rat model. (A) Metabolite features altered only under acute SR. Each data point represents the mean of 10 measurements across each group for each feature; FA1, forced activity control day 1; SR1, sleep restriction day 1. Suffix “a” or “b” denotes study A or study B, respectively. Red indicates elevation and green indicates reduction compared with BL. (B) Metabolites altered only under chronic SR are divided into those that recovered (Upper) and those that remained altered (Lower) following 3-d recovery sleep. Labels as in Fig. 1, with recovery (Rec) time points at days 1 and 3 after SR. (C) Metabolites altered under both acute and chronic SR are divided into those that recovered (Upper) and those that remained perturbed (Lower).
Fig. 3.
Fig. 3.
Experimental protocol and metabolomics of human subjects. (A) Protocol for human SR study consisting of two BL nights followed by five nights of SR and one night recovery (Rec) sleep. Blood samples for metabolomics (M) were collected in the morning as indicated. Black bars, sleep periods; white bars, wake periods; gray bar, 0800 hours to 1000 hours additional TIB sleep at BL2 in one protocol. (B and C) Heatmaps of metabolites significantly different between BL and SR divided into those that recovered (B) and those that remained perturbed (C). Each data point represents the mean of measurements from 10 individuals across each group for each feature.
Fig. 4.
Fig. 4.
Oxalate and DG 36:3 reflect cross-species sleep loss. (A) Venn diagram indicating two identified metabolites common to both rat and human studies. (B) Table of statistical values for rat and human datasets. (C) Fold change (FC) in oxalate (Upper) and DG 36:3 (Lower) levels from human serum. Measurement in each subject is linked by a solid line.

References

    1. Spaeth AM, Dinges DF, Goel N. Effects of experimental sleep restriction on weight gain, caloric intake, and meal timing in healthy adults. Sleep. 2013;36(7):981–990. - PMC - PubMed
    1. Markwald RR, et al. Impact of insufficient sleep on total daily energy expenditure, food intake, and weight gain. Proc Natl Acad Sci USA. 2013;110(14):5695–5700. - PMC - PubMed
    1. Singh M, Drake CL, Roehrs T, Hudgel DW, Roth T. The association between obesity and short sleep duration: A population-based study. J Clin Sleep Med. 2005;1(4):357–363. - PubMed
    1. Di Milia L, Vandelanotte C, Duncan MJ. The association between short sleep and obesity after controlling for demographic, lifestyle, work and health related factors. Sleep Med. 2013;14(4):319–323. - PubMed
    1. Schmid SM, Hallschmid M, Schultes B. The metabolic burden of sleep loss. Lancet Diabetes Endocrinol. 2014;3(1):52–62. - PubMed

Publication types

MeSH terms

LinkOut - more resources