. 2015 Feb 24;112(8):2593-8.
doi: 10.1073/pnas.1419921112. Epub 2015 Feb 9.

Elevated intraocular pressure decreases response sensitivity of inner retinal neurons in experimental glaucoma mice

Affiliations

Elevated intraocular pressure decreases response sensitivity of inner retinal neurons in experimental glaucoma mice

Ji-Jie Pang et al. Proc Natl Acad Sci U S A. .

Abstract

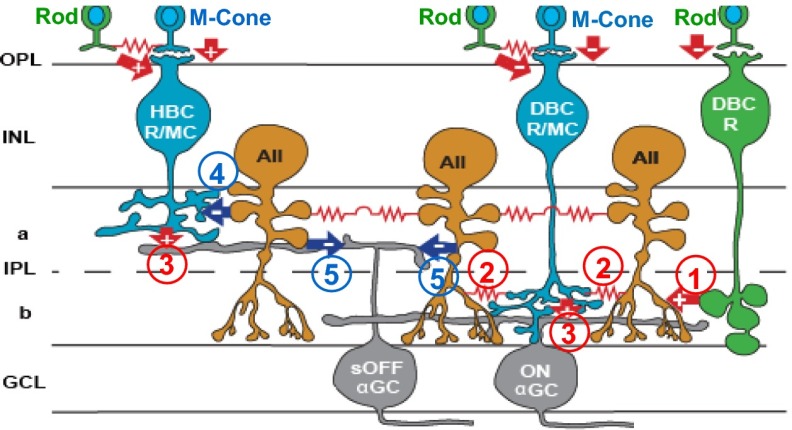
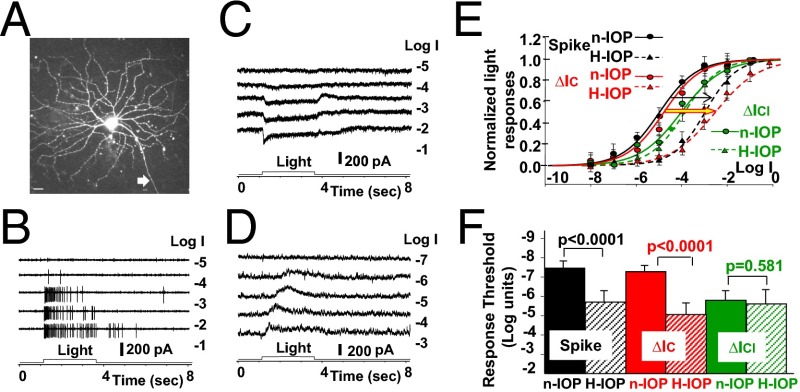
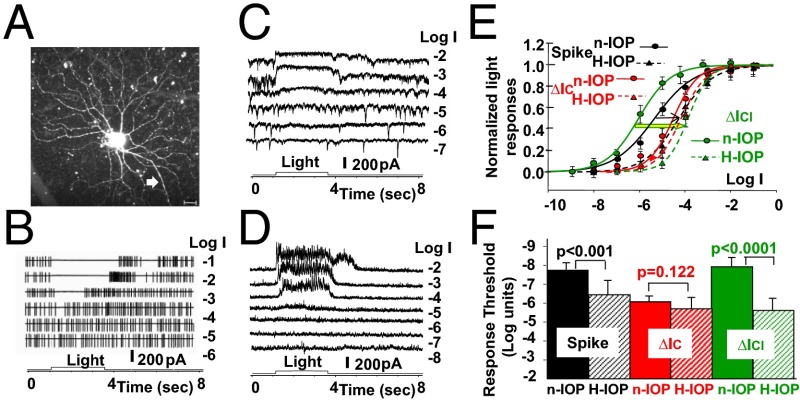
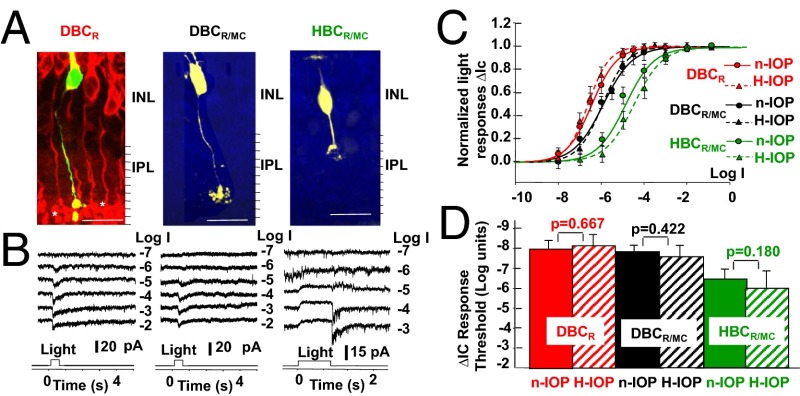
Glaucoma is the second leading cause of blindness in the United States and the world, characterized by progressive degeneration of the optic nerve and retinal ganglion cells (RGCs). Glaucoma patients exhibit an early diffuse loss of retinal sensitivity followed by focal loss of RGCs in sectored patterns. Recent evidence has suggested that this early sensitivity loss may be associated with dysfunctions in the inner retina, but detailed cellular and synaptic mechanisms underlying such sensitivity changes are largely unknown. In this study, we use whole-cell voltage-clamp techniques to analyze light responses of individual bipolar cells (BCs), AII amacrine cells (AIIACs), and ON and sustained OFF alpha-ganglion cells (ONαGCs and sOFFαGCs) in dark-adapted mouse retinas with elevated intraocular pressure (IOP). We present evidence showing that elevated IOP suppresses the rod ON BC inputs to AIIACs, resulting in less sensitive AIIACs, which alter AIIAC inputs to ONαGCs via the AIIAC→cone ON BC→ONαGC pathway, resulting in lower ONαGC sensitivity. The altered AIIAC response also reduces sOFFαGC sensitivity via the AIIAC→sOFFαGC chemical synapses. These sensitivity decreases in αGCs and AIIACs were found in mice with elevated IOP for 3-7 wk, a stage when little RGC or optic nerve degeneration was observed. Our finding that elevated IOP alters neuronal function in the inner retina before irreversible structural damage occurs provides useful information for developing new diagnostic tools and treatments for glaucoma in human patients.

Keywords: AII amacrine cells; bipolar cells; ganglion cells; glaucoma; intraocular pressure.


Conflict of interest statement

The authors declare no conflict of interest.

Figures

Fig. 1.
Fig. 1.
Schematic diagram of major synaptic connections in the ON and OFF α-ganglion pathways in the mouse retina. Green, rods and rod BCs; blue, M cones and mixed rod/M-cone BCs; orange, AIIACs; gray, αGCs; arrows, chemical synapses (red, glutamatergic; blue, glycinergic; +, sign-preserving; −, sign-inverting); zigzag (red), electrical synapses. a, sublamina a; b, sublamina b; GCL, ganglion cell layer; INL, inner nuclear layer; IPL, inner plexiform layer; OPL, outer plexiform layer; PRL, photoreceptor layer. Synapses directly relevant to this study are marked with numbers in circles: 1: DBCR→AIIAC glutamatergic; 2: DBCC↔AIIAC electrical; 3: DBCR/MC/HBCR/MC→ONαGC/sOFFαGC glutamatergic; 4: AIIAC→HBCR/MC glycinergic; and 5: AIIAC→sOFFαGC glycinergic.
Fig. 2.
Fig. 2.
Light responses of ONαGCs in high-IOP and normal-IOP mice. (A) Confocal image of an LY-filled ONαGC in an H-IOP mouse (white arrow, axon). (Scale bar, 20 µm.) (BD) The cell’s light-evoked spike responses, cation current, and chloride current to 500-nm light steps of various intensities are shown in BD, respectively. (E) The normalized, average response–intensity relations of six ONαGCs in H-IOP mice [population Rmax (mean ± SE) for spike, ΔIC, and ΔICl responses: 88 ± 37 per s, 203 ± 16 pA, and 194 ± 18 pA] are shown as dotted curves, whereas the corresponding R-Log I relations obtained from ONαGCs in normal mice [n = 18, population Rmax (mean ± SE) for spike, ΔIC, and ΔICl responses: 97 ± 42 per s, 218 ± 21 pA, and 183 ± 13 pA) are shown as solid curves for comparison. Black, spike responses; red, ∆IC; green, ∆ICl. Arrows indicate H-IOP–induced shifts of the R-Log I relations. (F) Bar graphs of the average light response thresholds (mean ± SE), defined as the light intensity eliciting 5% of the maximum response of spike responses, ∆IC, and ∆ICl in control and H-IOP mouse retinas; the significance levels of the threshold differences are given by the P values of the t test.
Fig. 3.
Fig. 3.
Light responses of sOFFαGCs in H-IOP and n-IOP mice. (A) Confocal image of an LY-filled sOFFαGC in an H-IOP mouse (white arrow, axon). (Scale bar, 20 µm.) (BD) The cell’s light-evoked spike responses, ΔIC, and ΔICl to 500-nm light steps of various intensities are shown in BD, respectively. (E) The normalized, average R-Log I relations of seven sOFFαGCs in H-IOP mice [population Rmax (mean ± SE) for spike, ΔIC, and ΔICl responses: 12 ± 8 per s, 181 ± 15 pA, and 250 ± 25 pA] are shown as dotted curves, whereas the corresponding R-Log I relations obtained from sOFFαGCs in n-IOP mice [n = 15, population Rmax (mean ± SE) for spike, ΔIC, and ΔICl responses: 14 ± 8 per s, 162 ± 16 pA, and 241 ± 33 pA) are shown as solid curves for comparison. Black, spike responses; red, ∆IC; green, ∆ICl. Colored arrows indicate H-IOP–induced shifts of the R-Log I relations. (F) Bar graphs of the average light response thresholds (mean ± SE) of spike responses, ∆IC, and ∆ICl in n-IOP and H-IOP mouse retinas; the significance levels of the threshold differences are given by the P values of the t test.
Fig. 4.
Fig. 4.
Light responses of HBCR/MCs, DBCR/MCs, and DBCRs in H-IOP and n-IOP mice. (A) Confocal images of an LY-filled (yellow) HBCR/MC, DBCR/MC, and DBCR in dark-adapted living retinal slices of mice with elevated IOP (retinal slices with DBCRs were counterstained with anti-PKCα; red). (Scale bars, 20 µm.) (B) ΔIC to 500-nm light steps of various intensities. (C) Normalized, average R-Log I relations of 4 HBCR/MCs (green), 3 DBCR/MCs (black), and 5 DBCRs (red) in H-IOP mice [population Rmax (mean ± SE) for HBCR/MC, DBCR/MC, and DBCR responses: 13 ± 4 pA, 20 ± 8 pA, and 23 ± 10 pA] are shown as dotted curves, whereas the corresponding R-Log I relations obtained from 7 HBCR/MCs, 6 DBCR/MCs, and 11 DBCRs in n-IOP mice [population Rmax (mean ± SE) for HBCR/MC, DBCR/MC, and DBCR responses: 13 ± 5 pA, 26 ± 10 pA, and 28 ± 12 pA] are shown as solid curves. (D) Bar graphs of the average thresholds (mean ± SE) of ∆IC in n-IOP and H-IOP mouse retinas; the significance levels of the threshold differences are given by the P values of the t test.
Fig. 5.
Fig. 5.
Light responses of AIIACs in H-IOP and n-IOP mice. (AE) Confocal image of LY-filled AIIACs in an H-IOP mouse (A) and its current–voltage (I-V) responses (B) and cation current responses to 500-nm light steps of various intensities in control solution (C), in the presence of 100 µM DNQX (D), and in the presence of 100 µM DNQX + 100 µM MFA (E). (F) Average R-Log I relations (mean ± SE) measured under various conditions in H-IOP mice are plotted as dashed curves (black, control solution, n = 6; red, DNQX, n = 5; green, DNQX+MFA, n = 3), and the average R-Log I relations in control solution and in DNQX in n-IOP mice are plotted as solid curves (black, control solution, n = 15; red, DNQX, n = 11). (G) Bar graphs of the average thresholds (mean ± SE) in n-IOP and H-IOP mice; the significance levels of the threshold differences are given by the P values of the t test. (Scale bar, A: 20 μm.)

References

    1. Quigley HA, Broman AT. The number of people with glaucoma worldwide in 2010 and 2020. Br J Ophthalmol. 2006;90(3):262–267. - PMC - PubMed
    1. Gordon MO, et al. The Ocular Hypertension Treatment Study: Baseline factors that predict the onset of primary open-angle glaucoma. Arch Ophthalmol. 2002;120(6):714–720, discussion 829–830. - PubMed
    1. Quigley HA, Green WR. The histology of human glaucoma cupping and optic nerve damage: Clinicopathologic correlation in 21 eyes. Ophthalmology. 1979;86(10):1803–1830. - PubMed
    1. Lee BL, et al. The Glaucoma Symptom Scale. A brief index of glaucoma-specific symptoms. Arch Ophthalmol. 1998;116(7):861–866. - PubMed
    1. Quigley HA. Ganglion cell death in glaucoma: Pathology recapitulates ontogeny. Aust N Z J Ophthalmol. 1995;23(2):85–91. - PubMed

Publication types

MeSH terms