Review
. 2015 Mar;35(1):43-57.
doi: 10.1016/j.cll.2014.10.002. Epub 2014 Dec 18.

Red blood cell population dynamics

Affiliations
Review

Red blood cell population dynamics

John M Higgins. Clin Lab Med. 2015 Mar.

Abstract

Hematology analyzers provide a static snapshot of the circulating population of red blood cells (RBCs). The RBC population is rapidly changing, with more than 2 million RBCs turning over every second in the typical healthy adult. The static snapshot provided by the complete blood count does not capture many of the dynamic aspects of this population, such as the rate of RBC maturation and the rate of RBC turnover. By integrating basic science with hematology analyzer measurements, it is possible to estimate the rates of these dynamic processes, yielding new insights into human physiology, with potential diagnostic application.

Keywords: Diagnostic applications; Mathematical modeling; Personalized medicine; Predictive medicine; RBC life span; RBC turnover; Red blood cell population dynamics; Single-RBC measurements.


Figures

Fig. 1
Fig. 1
Changes occurring over the course of the life span of an RBC in the circulation. Single-RBC changes in volume and HGB content integrate over the population and over time to determine the variance in volume and Hb content measured in a CBC. Reticulocytes exit from the bone marrow (top right). Their volume and Hb content decline over the course of their ~110-day life span. The single-RBC dynamic processes combine to generate the distributions in volume (RDW) and Hb content, which can be measured by some modern hematology analyzers.
Fig. 2
Fig. 2
Single-RBC (red) and single-reticulocyte (blue) volume and Hb mass distributions. The red contours show the probability density for volume and Hb in the total RBC population of a healthy adult. The red circle shows the MCV, MCH position. The RDW bar shows the extent of the coefficient of variation in volume. There is a thin gray line connecting the MCV, MCH point (red circle) to the origin and representing the MCHC. Red contours enclose 90%, 75%, 50%, and 25% percent of cells close to the mean. The blue contours show the same probability density for reticulocytes, with the mean volume and Hb content (rMCV, rMCH) shown as a blue circle. The rRDW bar shows the extent of the coefficient of variation in volume. There is a thin gray line connecting the rMCV, rMCH point to the origin, which represents the average reticulocyte Hb concentration (rMCHC). Blue contours enclose 75%, 50%, and 25% of cells.
Fig. 3
Fig. 3
Trajectories for an individual maturing RBC. The large red circle in the top right represents a reticulocyte sampled from the reticulocyte volume–Hb content distribution (light blue oval). The smaller red circle represents a typical mature RBC sampled from the RBC volume– Hb content distribution (red oval). The green dashed lines represent 3 hypothetical trajectories. The top trajectory requires an increase in single-RBC Hb content, and any model requiring that sort of trajectory can be excluded based on basic science knowledge. The bottom straight line trajectory can be excluded, because it passes through a space in the plane not covered by either the RBC distribution (red oval) or the reticulocyte distribution (blue oval). Empirical measurements show that no RBCs of any age are found in these regions, and models requiring this sort of trajectory can be excluded. The middle trajectory is most consistent with basic science findings and hematology instrument measurements.
Fig. 4
Fig. 4
An example model of RBC population dynamics. Reticulocytes enter from the bone marrow. Their volume and Hb content decrease rapidly at first toward the population mean (gray line through the red circle marking the MCV and MCH). The volume and Hb content of a single RBC continue to decrease with small fluctuations until the cell is cleared and recycled, with the probability of clearance approximated by a threshold function of the volume and Hb level of the RBC. A cell with Hb concentration equal to the MCHC is most likely to be cleared when its volume reaches vc. Cells with higher or lower Hb concentrations are more likely to be cleared at lower or higher volumes, as shown by the clearance threshold line.
Fig. 5
Fig. 5
A model of RBC volume and Hb dynamics. Reticulocytes enter from the bone marrow (top right). Their volume and Hb content decrease rapidly at first toward the population mean (center of thick black line designated as MCHC), with βv quantifying the rate of volume change and βh quantifying the rate of Hb change. The volume and Hb content of a single RBC continue to decrease (α) with small fluctuations (Dv and Dh), until the cell is cleared and recycled, with the probability of clearance approximated by a threshold function of the volume and Hb of the RBC. A cell with Hb concentration equal to the MCHC is most likely to be cleared when its volume reaches vc. Cells with higher or lower Hb concentrations are more likely to be cleared at lower or higher volumes, as shown by the red clearance threshold line. The thick red horizontal arrows show the coefficient of variation in the vc and the MCV. There is less variation in the estimated clearance threshold.
Fig. 6
Fig. 6
Variation in traditional and dynamic CBC indices. The estimated clearance threshold (vc) has a smaller coefficient of variation in 700 healthy individuals than any of the other traditional CBC indices or the reticulocyte count. The clearance threshold therefore has the potential to be a specific marker of disease, because any variation would be easily distinguishable from the narrow normal range.
Fig. 7
Fig. 7
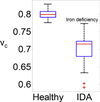
Clearance threshold in healthy individuals and those with iron deficiency anemia (IDA). The clearance threshold is expressed as a fraction of the MCV, with vc equal to the volume at which an RBC with an Hb concentration equal to the population mean MCHC would be most likely to be cleared. Healthy individuals have a vc tightly clustered around 80% of the MCV. Individuals with IDA have a significantly lower vc. These individuals with IDA had vcs in the normal range before the development of IDA, and a decreased vc may therefore serve as an early warning sign for impending IDA.
Fig. 8
Fig. 8
Hypothesized homeostatic mechanism for RBC clearance delay. The lowered RBC clearance threshold found in patients with decreased erythropoiesis is typical of iron deficiency anemia and suggests that the clearance delay may serve as a temporary compensatory response to decreased RBC production, maintaining RBC mass in the face of decreased production. Left-hand panels show a schematic of the mechanism. Right-hand panels show support for this idea provided by CBC results for an individual when healthy (top right), with frank iron deficiency anemia (bottom right), and a latent anemia state 2 months before the anemia, when the evidence of clearance delay is shown by the increasing fraction of the RBCs appearing lower than the 85th percentile (red shaded regions in each right-hand panel) along the MCHC line.

References

    1. Mohandas N, Kim YR, Tycko DH, et al. Accurate and independent measurement of volume and hemoglobin concentration of individual red-cells by laser-light scattering. Blood. 1986;68:506–513. - PubMed
    1. Donofrio G, Chirillo R, Zini G, et al. Simultaneous measurement of reticulocyte and red blood cell indices in healthy subjects and patients with microcytic and macrocytic anemia. Blood. 1995;85:818–823. - PubMed
    1. Donofrio G, Zini G, Tommasi M, et al. Automated measurement of total and immature reticulocytes, nucleated red blood cells and apoptotic cells in peripheral blood and bone marrow. Blood. 1996;88:3182.
    1. Liesveld JL, Rowe JM, Lichtman MA. Variability of the erythropoietic response in autoimmune hemolytic anemia–analysis of 109 cases. Blood. 1987;69:820–826. - PubMed
    1. Bain BJ. Leukaemia diagnosis. 3rd edition. Malden (MA): Blackwell; 2003.

Publication types