. 2015 Jul;22(7):873-83.
doi: 10.1177/1933719115570907. Epub 2015 Feb 11.

Dating Endometriotic Ovarian Cysts Based on the Content of Cyst Fluid and its Potential Clinical Implications

Affiliations

Dating Endometriotic Ovarian Cysts Based on the Content of Cyst Fluid and its Potential Clinical Implications

Sun-Wei Guo et al. Reprod Sci. 2015 Jul.

Abstract

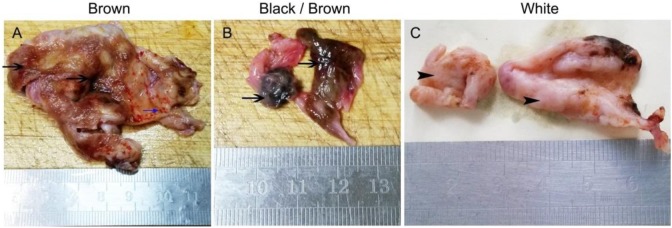
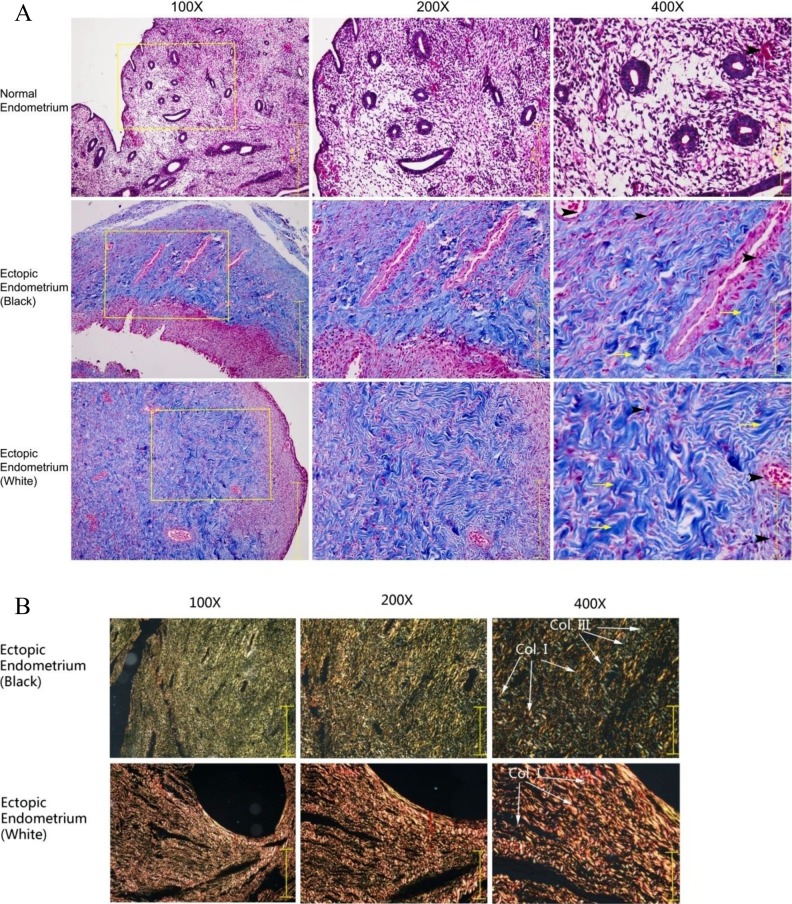
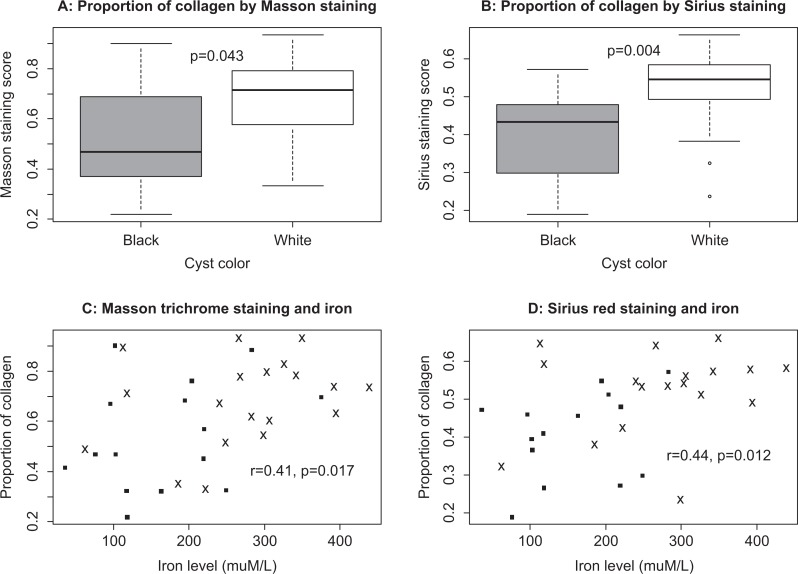
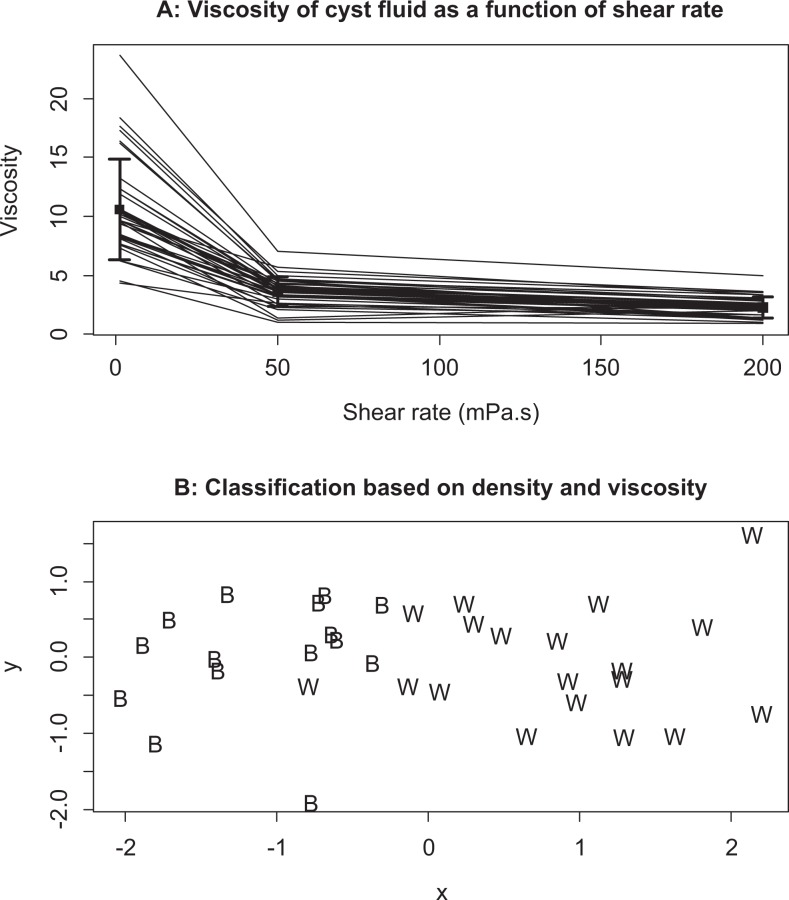
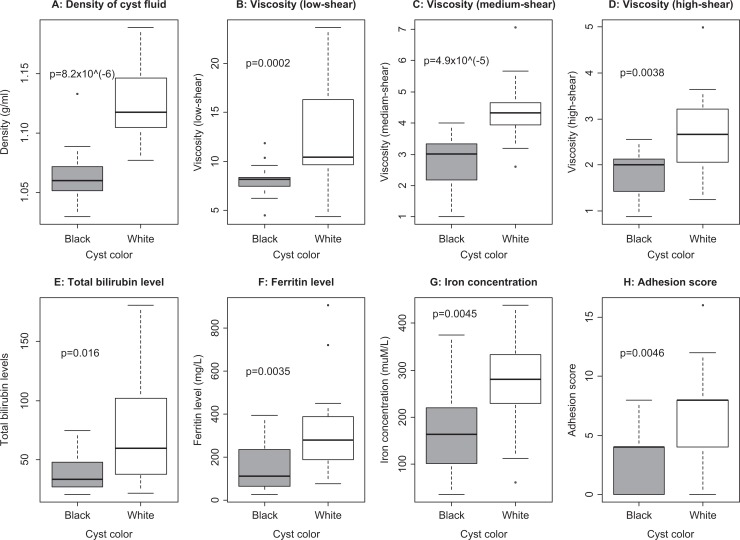
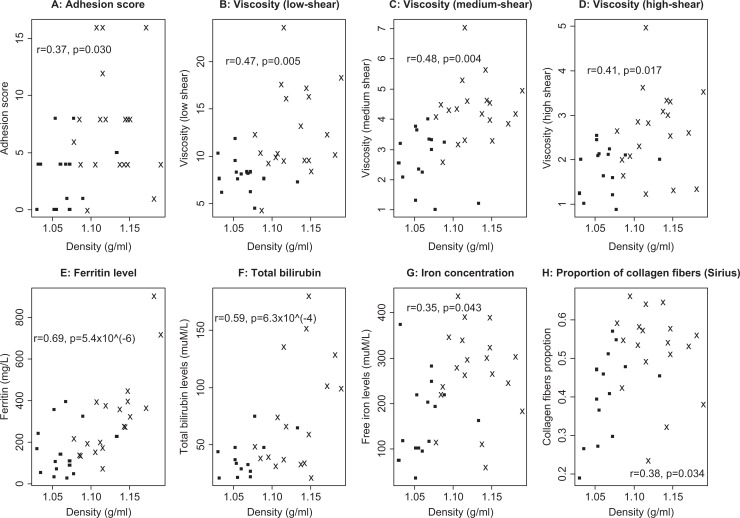
This study was undertaken to test the hypotheses that, due to gradual accumulation of dead erythrocytes and their ingested products resulting from repeated hemorrhage, older endometriomas (whitish in color) contain chocolate fluid with higher iron content than younger (brownish/blackish in color) ones with concomitant higher collagen content and more adhesions. We recruited 30 premenopausal women with histologically confirmed ovarian endometriomas and collected samples of their endometriotic lesions and chocolate fluid and measured the viscosity, density, and the concentration of total bilirubin, ferritin, and free iron of the chocolate fluid. We also evaluated the lesion color and adhesion scores. In addition, we performed Masson trichrome and Picro-Sirius red staining on all endometriotic cysts and evaluated the extent of fibrosis in the lesions. We found that fluids taken from white-colored endometriomas had significantly higher concentration of total bilirubin, ferritin, and free iron, respectively, than black/brown-colored ones. In addition, older cysts had fluids that had significantly higher density and viscosity. Fluid density correlated positively with the concentrations of total bilirubin, ferritin, and free iron. Older lesions had significantly more collagen content and higher adhesion scores. Taken together, these data supports the notion that older cysts, having experienced more bleeding episodes, contain chocolate fluid that is higher in viscosity, density, and iron content and higher fibrotic content than younger ones. This provides another piece of evidence that endometriotic lesions are wounds that undergo repeated injury and repair, resulting ultimately fibrotic lesions that are resistant to hormonal treatment.

Keywords: chocolate fluid; collagen I; iron content; lesion age; ovarian endometriomas.


Conflict of interest statement

Declaration of Conflicting Interests: The author(s) declared no potential conflicts of interest with respect to the research, authorship, and/or publication of this article.

Figures

Figure 1.
Figure 1.
Representative coloration of ovarian endometriomas. The blackish/brownish lesions and whitish lesions were marked with different type of black arrows. The fresh red hemorrhaging spot was marked with blue arrow. The ruler shown in the picture is in unit of centimeter (cm). (The color version of this figure is available in the online version at http://rs.sagepub.com/.)
Figure 2.
Figure 2.
Panel A, representative Masson trichrome staining results of normal human endometrium (top panel) and ectopic human endometrium (ovarian endometrioma: black lesion and white lesion, in middle and lower panels). Magnification in all left, middle, and right column of figures are as indicated: 100×, 200×, and 400×. The scale bar represents 502, 251, and 125 μm, accordingly. Yellow arrows point to collagen fibers stained in blue, while black arrows indicate muscle fibers stained in red. Panel B, representative Picro-Sirius red staining results of black- and white-colored endometriotic ovarian cysts viewed under a polarized microscope. Magnification in all left, middle, and right column of figures are as indicated: 100×, 200×, and 400×. The scale bar represents 502, 251, and 125 μm accordingly. Collagen fibers stained in red are marked with white long arrows. Collagen fibers stained in red or yellow are type I, and those stained in green are type III. Col: collagen; I: type I; III: type III. (The color version of this figure is available in the online version at http://rs.sagepub.com/.)
Figure 3.
Figure 3.
Boxplot of the proportion of areas containing collagen fibers between black- and white-colored cysts, as measured by Masson trichrome staining (A) or Sirius red staining (B). The statistical significance of between-group difference is shown by the P value. C and D, Scatter plot of the proportion of areas containing collagen fibers, as measured by Masson trichrome staining (C) or Sirius red staining (D), versus the iron content in the cyst fluid. The squared dots represent black-colored cysts while the crosses represent white-colored cysts. The Pearson correlation coefficient, along with its statistical significance, is shown in the figure.
Figure 4.
Figure 4.
A, Measured viscosity of cyst fluid as a function of shear stress. Different lines represent data from different samples. The thick black line represents the mean values, with their standard deviations. B, Classification of ovarian cyst tissue samples by multidimensional scaling using the density and the viscosity (medium-shear force) of the cyst fluid. B: black-colored cysts; W: white-colored cysts.
Figure 5.
Figure 5.
Boxplots of the density (A), viscosity of cyst fluid (B-D), total bilirubin (E), soluble ferritin (F), iron in cyst fluid (G), and adhesion scores (H) between black- and white-colored cysts. The statistical significance of between-group difference is shown by the P value.
Figure 6.
Figure 6.
Scatter plots showing the relationship between density of cyst fluid and (A) adhesion score of the ovarian cyst, (B-D) viscosity of the cyst fluid, (E) soluble ferritin, (F) total bilirubin, (G) iron concentration in the cyst fluid, and (H) the proportion of areas containing collagen fibers per Sirius red staining. The squared dots represent black-colored cysts while the crosses represent white-colored cysts. The Pearson’s correlation coefficient, along with its statistical significance, is shown in the figure.

Similar articles

Cited by

References

    1. Nisolle M, Donnez J. Peritoneal endometriosis, ovarian endometriosis, and adenomyotic nodules of the rectovaginal septum are three different entities. Fertil Steril. 1997;68 (4):585–596. - PubMed
    1. Vercellini P. Endometriosis: what a pain it is. Semin Reprod Endocrinol. 1997;15 (3):251–261. - PubMed
    1. Sampson JA. Perforating hemorrhagic (chocolate) cysts of the ovary. Tr Am Gynec Soc. 1921;46(1):162–236.
    1. Martin DC, Berry JD. Histology of chocolate cysts. J Gynecol Surg. 1990;6(1):43–46.
    1. Brosens IA, Puttemans PJ, Deprest J. The endoscopic localization of endometrial implants in the ovarian chocolate cyst. Fertil Steril. 1994;61 (6):1034–1038. - PubMed

Publication types