Review
. 2015 Jun;14(3):352-65.
doi: 10.1111/acel.12283. Epub 2015 Feb 9.

Gene expression defines natural changes in mammalian lifespan

Affiliations
Review

Gene expression defines natural changes in mammalian lifespan

Alexey A Fushan et al. Aging Cell. 2015 Jun.

Abstract

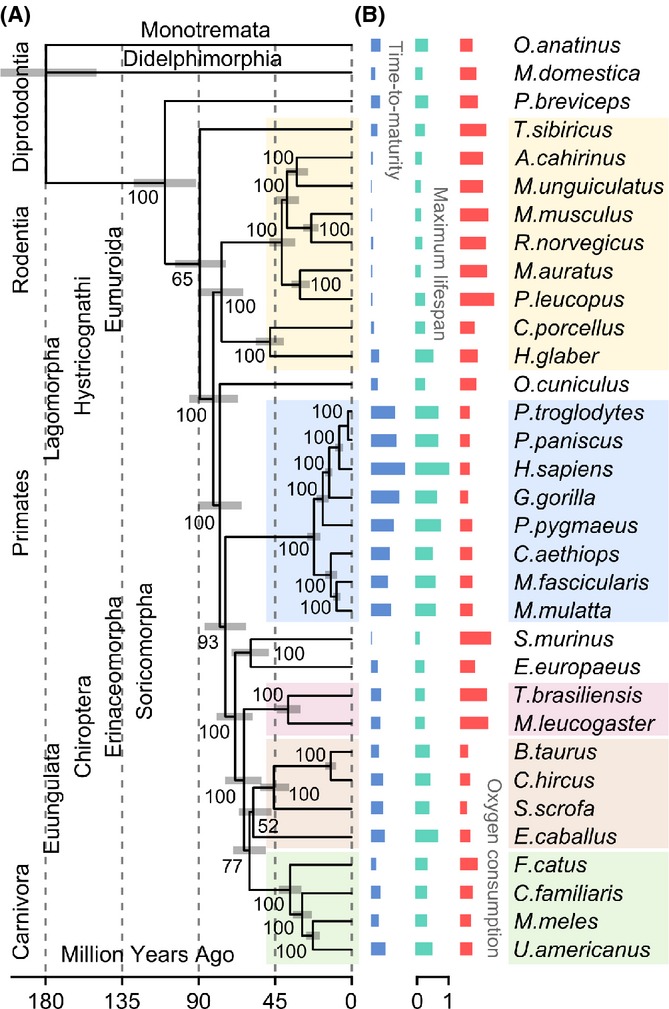
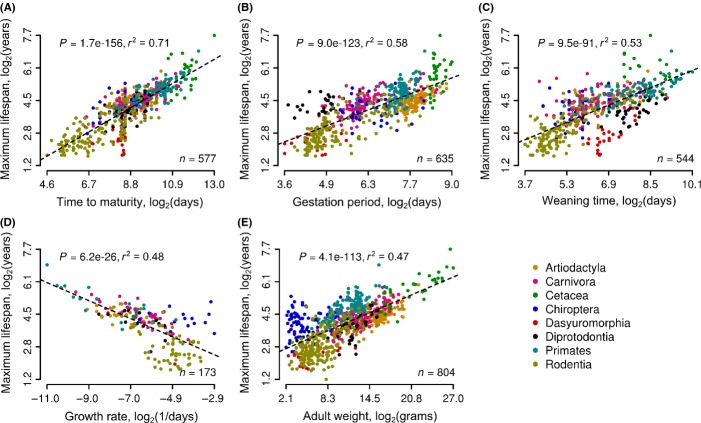
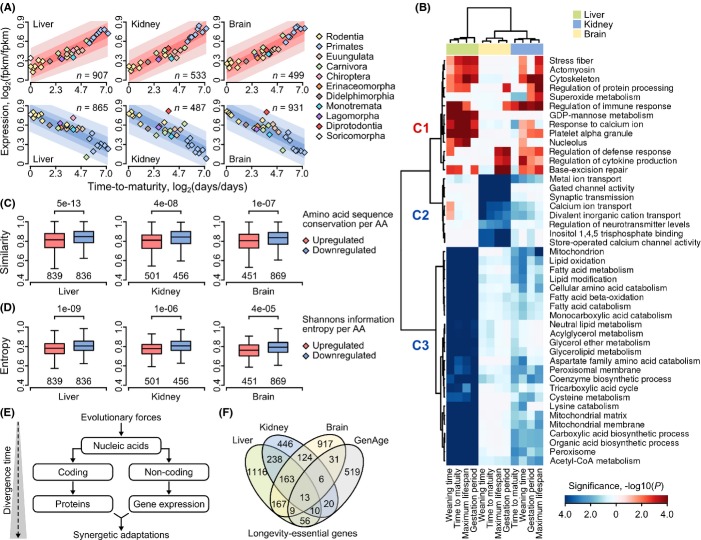
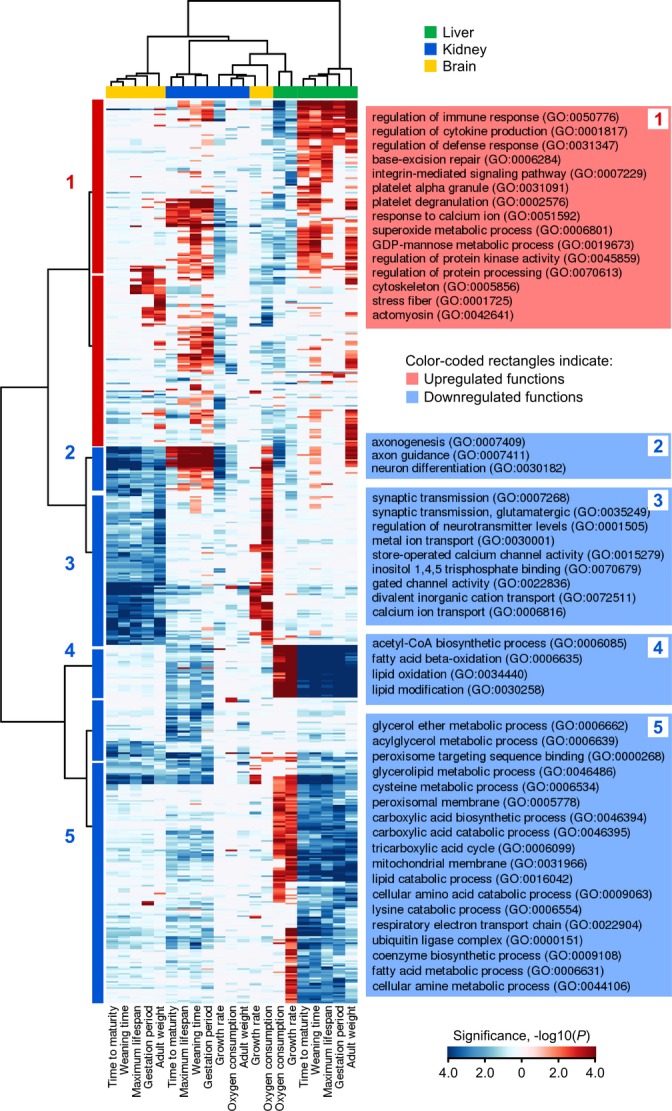
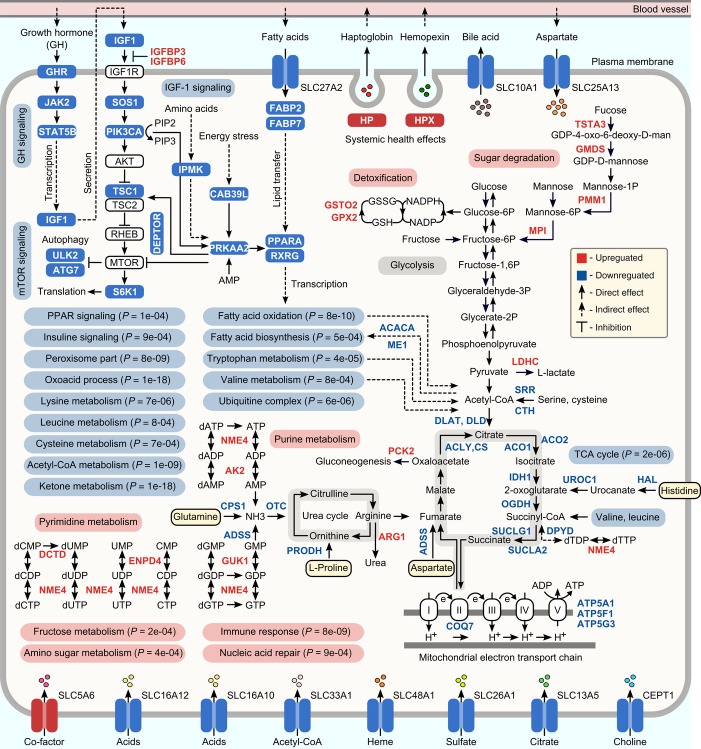
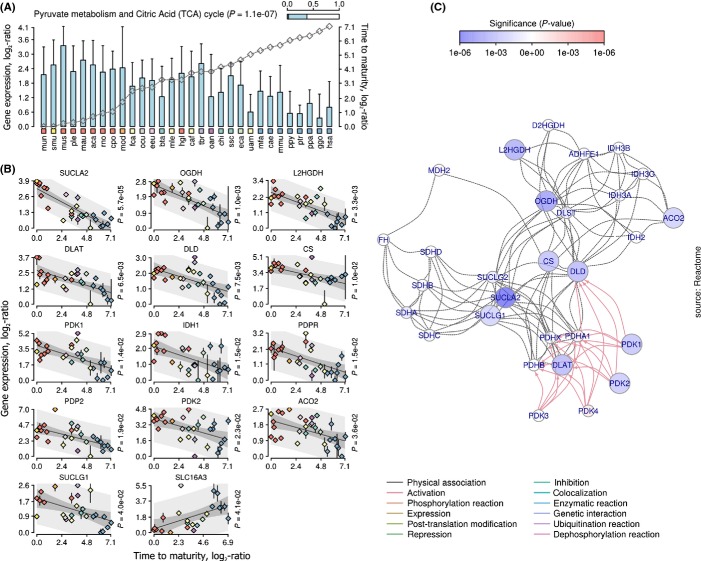
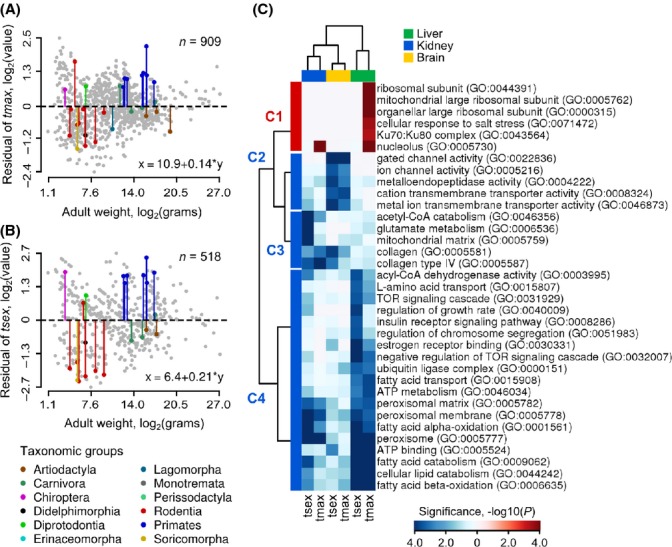
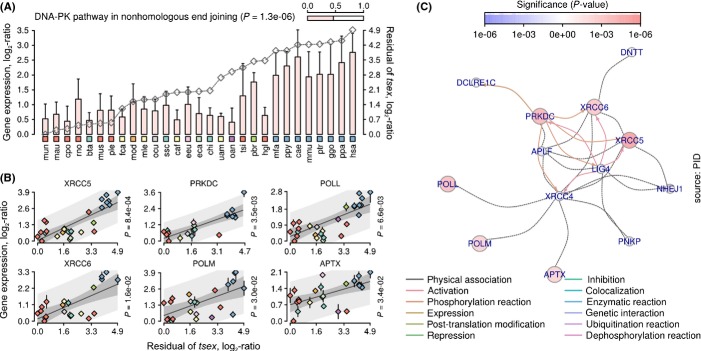
Mammals differ more than 100-fold in maximum lifespan, which can be altered in either direction during evolution, but the molecular basis for natural changes in longevity is not understood. Divergent evolution of mammals also led to extensive changes in gene expression within and between lineages. To understand the relationship between lifespan and variation in gene expression, we carried out RNA-seq-based gene expression analyses of liver, kidney, and brain of 33 diverse species of mammals. Our analysis uncovered parallel evolution of gene expression and lifespan, as well as the associated life-history traits, and identified the processes and pathways involved. These findings provide direct insights into how nature reversibly adjusts lifespan and other traits during adaptive radiation of lineages.

Keywords: aging; gene expression; life-history traits; lifespan; mammals.


Figures

Fig 1
Fig 1
Species phylogeny and life-history traits. (A) Chronogram tree demonstrating phylogenetic relationships between mammals. Bootstrap support for the branching order of 33 species was reconstructed with 1000 randomization steps. Species divergence time is plotted as upper and lower-bounded intervals (gray bars). (B) Comparative plots of the life histories. From left to right: time to maturity, maximum lifespan, and oxygen consumption. Each bar denotes a value of life-history variable for a particular organism in standard scale.
Fig 2
Fig 2
Relationship between maximum lifespan and other life histories. (A) Time to maturity. (B) Gestation period. (C) Weaning time. (D) Growth rate (Gompertz coefficient). (E) Adult weight. Number of informative species (n) used in the analysis is indicated in the bottom right corner of each plot. Lineages are highlighted with distinct colors (legend in the bottom right corner). Determination coefficient (r-squared) and statistical significance of correlation (P, F-test) are indicated at the top of each panel.
Fig 3
Fig 3
Covariance of transcript levels and life-history variation. (A) Cumulative expression profiles of transcripts associated with time to maturity. Genes positively correlated with life-history variation are plotted on the top panel (pink), and negatively correlated on the bottom panel (blue). Vertical axes denote relative FPKM (log2 ratio of mean FPKM of a given species to minimal mean FPKM observed among species) in standard scale. Horizontal axes denote relative time to maturity (log2 ratio of a given value to minimal observed value). Each rhomb on the plot denotes mean expression value of all genes (n) for a particular organism. Shaded areas denote 60%, 75%, and 90% upper and lower quantiles of log2 ratio distribution. (B) A cluster map that shows GO terms for genes associated with gradient of life-history variation. Columns on the plot correspond to a particular trait (indicated at the bottom). Rows on the plot show GO terms. Upregulated GO terms are in red. Downregulated GO terms are in blue. Magnitude of respective color denotes statistical significance of enrichment (negative logarithm of FDR-corrected P-value, bar at the bottom). (C) Conservation scores for molecules associated with gradient of time to maturity variation. Each panel shows distributions of per-residue similarity scores for up- (pink) and downregulated (blue) molecules for the liver, kidney, or brain. Numbers of individual orthologous groups examined in the analysis are indicated at the bottom of each bar. Significance of the difference between distributions was assessed with two-tailed Welch's t-tests (P-values at the top). (D) Shannon's information entropy for molecules significantly associated with gradient of time to maturity variation. Each panel shows distributions of per-residue entropy scores for up- (pink) and downregulated (blue) genes for the liver, kidney, or brain. (E) A model of parallel accumulation of changes in biological sequences and gene expression. (F) Overlap between gene sets associated with gradients of life-history variation and database longevity genes (mouse, fly, worm and yeast; from the GenAge dataset).
Fig 4
Fig 4
A cluster map that shows GO terms associated with gradient of life-history variation. Columns on the plot correspond to life histories (bottom). Rows show GO terms. Sub rectangles in red denote GO terms positively correlated with life-history variables. Negatively correlated GO terms are in blue. Color intensities denote statistical significance of GO term (negative logarithm of FDR corrected P-value, bar in the bottom right corner of plot). Life histories and GO terms were clustered using the Ward's method and Euclidean distance metric. GO terms were grouped into five clusters using constant height cutoff method (left side). Titles of representative GO terms are presented on the right side of plot (in brackets).
Fig 5
Fig 5
Schematic overview of genes and functions associated with gradient in lifespan variation in the liver. Rectangles in red indicate upregulated genes (FDR corrected < 0.05, F-test) or functions, while rectangles in blue indicate downregulated genes (FDR corrected < 0.05, F-test) or functions. Solid arrows denote direct effects (activation) when upstream partners interact with the targets, while dashed lines show an indirect effect (or compound entry in the pathway) occurring during downstream reactions. P-values denote statistical enrichment of biological pathways with significant genes (FDR corrected P, right-sided hypergeometric test). Refer to Dataset S1 for specific statistical details on GO functions.
Fig 6
Fig 6
Gene expression variation associated with the TCA cycle in liver. (A) Mean FPKM of all significant genes. Error bars indicate standard deviation of the mean. Gray line is the relative value of life-history variable (time to maturity, axis on the right). Species are shown at the bottom. Color-coded rectangles distinguish lineages. Bar at the top right shows proportion of significant genes from all genes associated with this pathway. P-value denotes statistical enrichment (right-sided hypergeometric test). (B) Genes whose expression variation correlates with life-history variation. Vertical axis is the relative FPKM log2-transformed. Horizontal axis is the relative life-history variable in logarithmic space. Rhombs are the means of FPKM. Colors of rhombs distinguish lineages. Error bars show standard deviation of the mean. P-value denotes significance of the OLS model. Median gray line is best-fit OLS line. Shaded areas indicate observed and predicted upper (95%) and lower (5%) confidence intervals. (C) Functional interaction network. Color of nodes denotes significance of the OLS model (scale on the top). Positively correlated genes are in red. Negatively correlated genes are in blue. Color of edges denotes type of interaction (bottom).
Fig 7
Fig 7
Gene expression signatures of the residual of life histories. (A) and (B) Plots show the residual of maximum lifespan (tmax) and maturation time (tsex) plotted against body weight, respectively. Vertical axes are the residuals log2-transformed. Horizontal axes denote body weight log2-transformed. n denotes total numbers of species. Species examined in the study are highlighted with colors (legend at the bottom). Equations in the bottom right corner of each plot define linear relationship between respective life histories and body weight. (C) A cluster map that shows GO terms associated with gradient of residual variation. Columns on the plot indicate residuals of tmax and tmax (bottom). Rows show GO terms. Sub rectangles in red denote GO terms positively correlated with residual variable. Negatively correlated GO terms are in blue. Color intensities denote statistical significance of GO term (logarithm of FDR corrected P-value, bottom right corner).
Fig 8
Fig 8
Gene expression variation associated with NHEJ positively correlates with residual of maximum lifespan and maturation time in liver. (A) Mean FPKM of all significant genes. Error bars indicate standard deviation of the mean. Gray line is the relative value of residual variable (time to maturity, axis on the right). Species are shown at the bottom. Color-coded rectangles distinguish lineages. Bar at the top right shows proportion of significant genes from all genes associated with this pathway. P-value denotes statistical enrichment (right-sided hypergeometric test). (B) Genes whose expression variation correlates with residual variation. Vertical axis is the relative FPKM log2-transformed. Horizontal axis is the residual of maturation time in logarithmic space. Rhombs are the means of FPKM. Colors of rhombs distinguish lineages. Error bars show standard deviation of the mean. P-value denotes significance of the OLS model. Median gray line is best-fit OLS line. Shaded areas indicate observed and predicted upper (95%) and lower (5%) confidence intervals. (C) Functional interaction network. Color of nodes denotes significance of the OLS model. Positively correlated genes are in red. Negatively correlated genes are in blue. Color of edges denotes type of interaction (bottom).

References

    1. Anderson RM, Weindruch R. Metabolic reprogramming, caloric restriction and aging. Trends Endocrinol. Metab. 2009;21:134–141. - PMC - PubMed
    1. Beldade P, Brakefield PM, Long AD. Contribution of Distal-less to quantitative variation in butterfly eyespots. Nature. 2002;415:315–318. - PubMed
    1. Blomberg SP, Garland T, Jr, Ives AR. Testing for phylogenetic signal in comparative data: behavioral traits are more labile. Evolution. 2003;57:717–745. - PubMed
    1. Brawand D, Soumillon M, Necsulea A, Julien P, Csardi G, Harrigan P, Weier M, Liechti A, Aximu-Petri A, Kircher M, Albert FW, Zeller U, Khaitovich P, Grutzner F, Bergmann S, Nielsen R, Paabo S, Kaessmann H. The evolution of gene expression levels in mammalian organs. Nature. 2011;478:343–348. - PubMed
    1. Burbea Z, Nakhoul F, Rosenberg S, Zoabi R, Skorecki K, Hochberg I, Miller-Lotan R, Benchetrit S, Weissgarten J, Knecht A, Tovbin D, Levy NS, Levy AP. Role of haptoglobin phenotype in end-stage kidney disease. Nephron Exp. Nephrol. 2004;97:e71–e76. - PubMed

Publication types

Associated data