. 2015 Feb;7(2):110-22.
doi: 10.18632/aging.100723.

Structural chromosome abnormalities, increased DNA strand breaks and DNA strand break repair deficiency in dermal fibroblasts from old female human donors

Affiliations

Structural chromosome abnormalities, increased DNA strand breaks and DNA strand break repair deficiency in dermal fibroblasts from old female human donors

Faiza Kalfalah et al. Aging (Albany NY). 2015 Feb.

Abstract

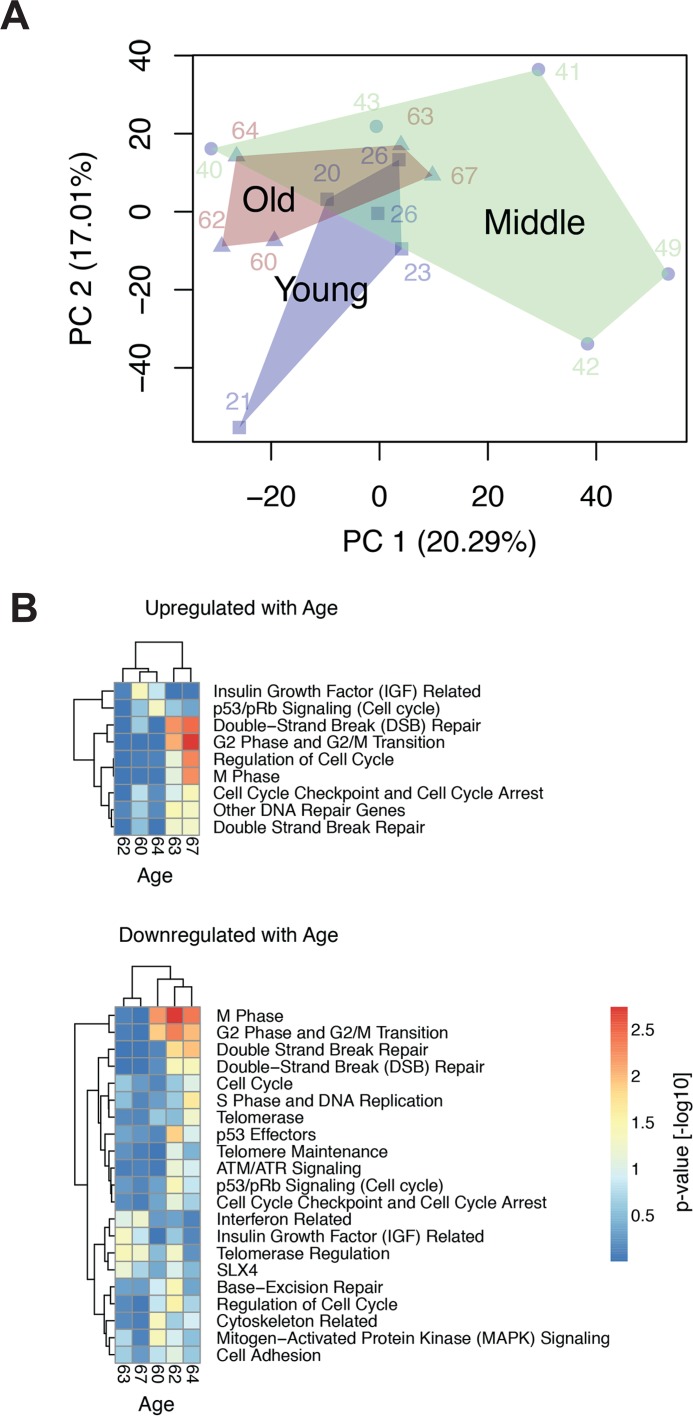
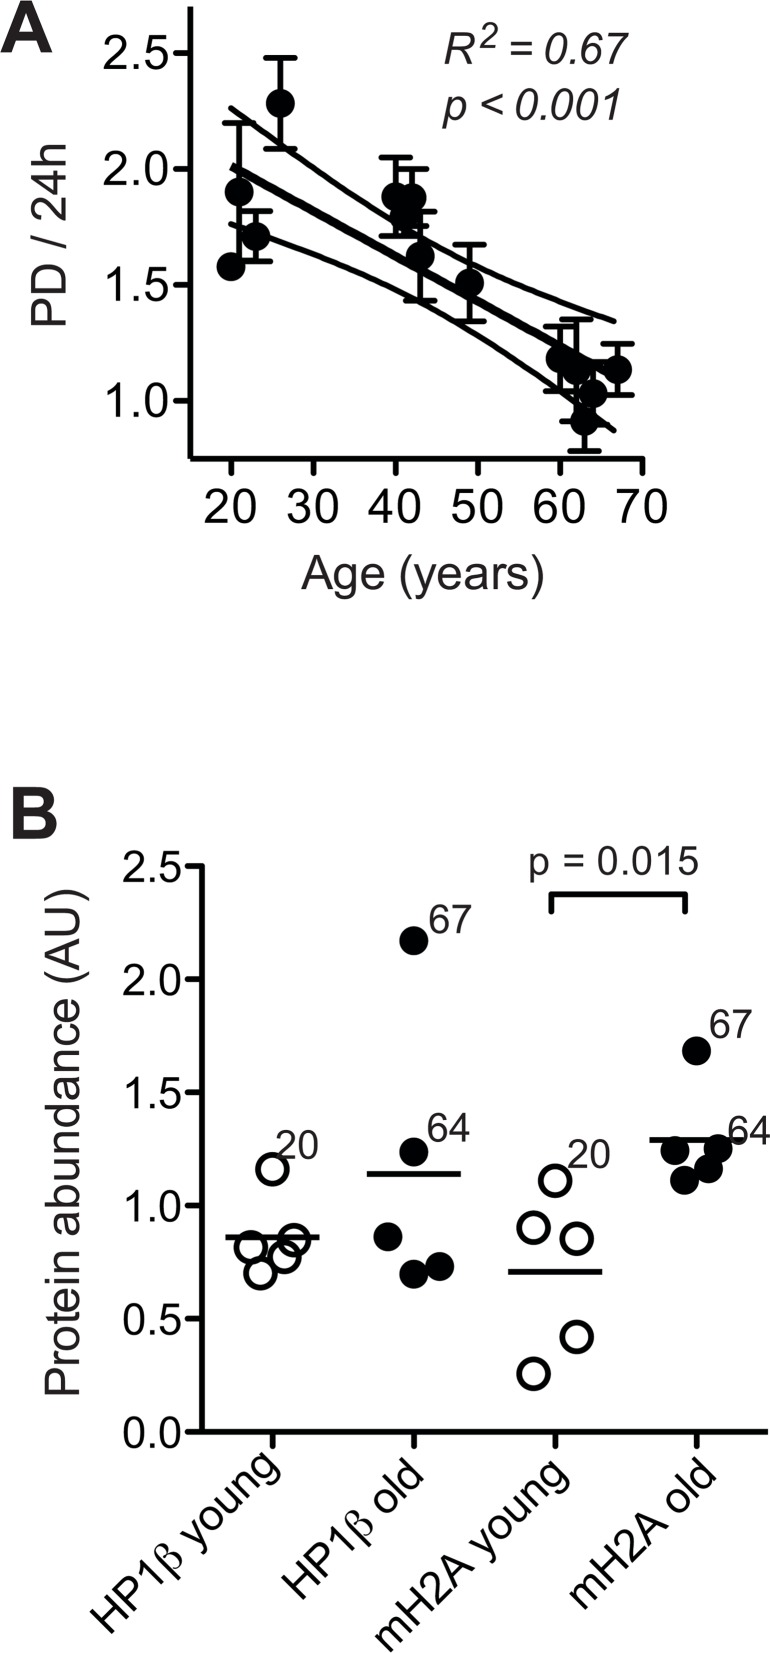
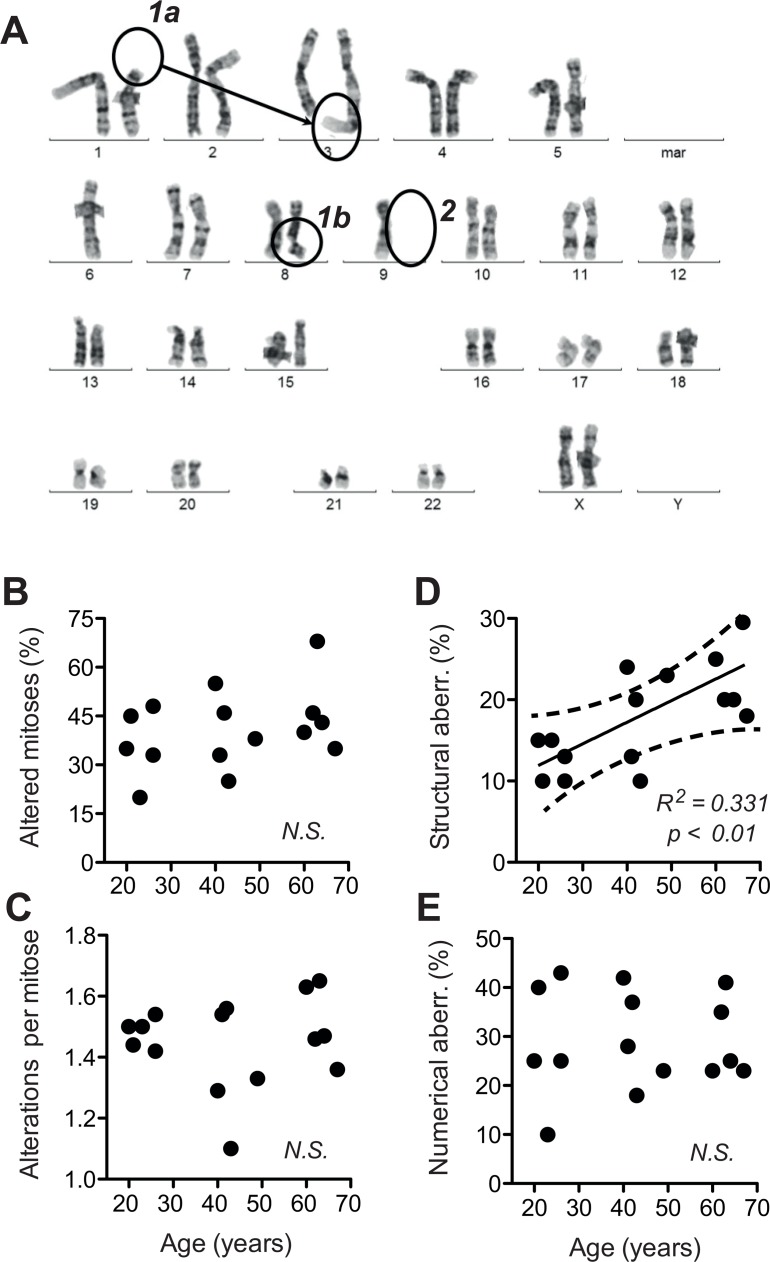
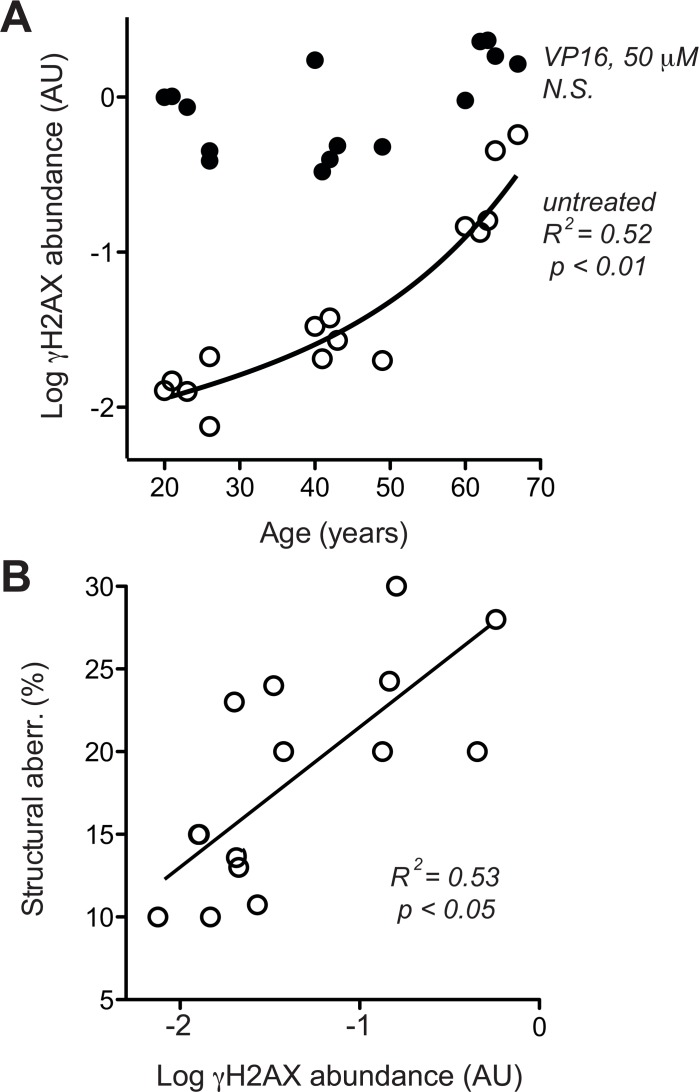
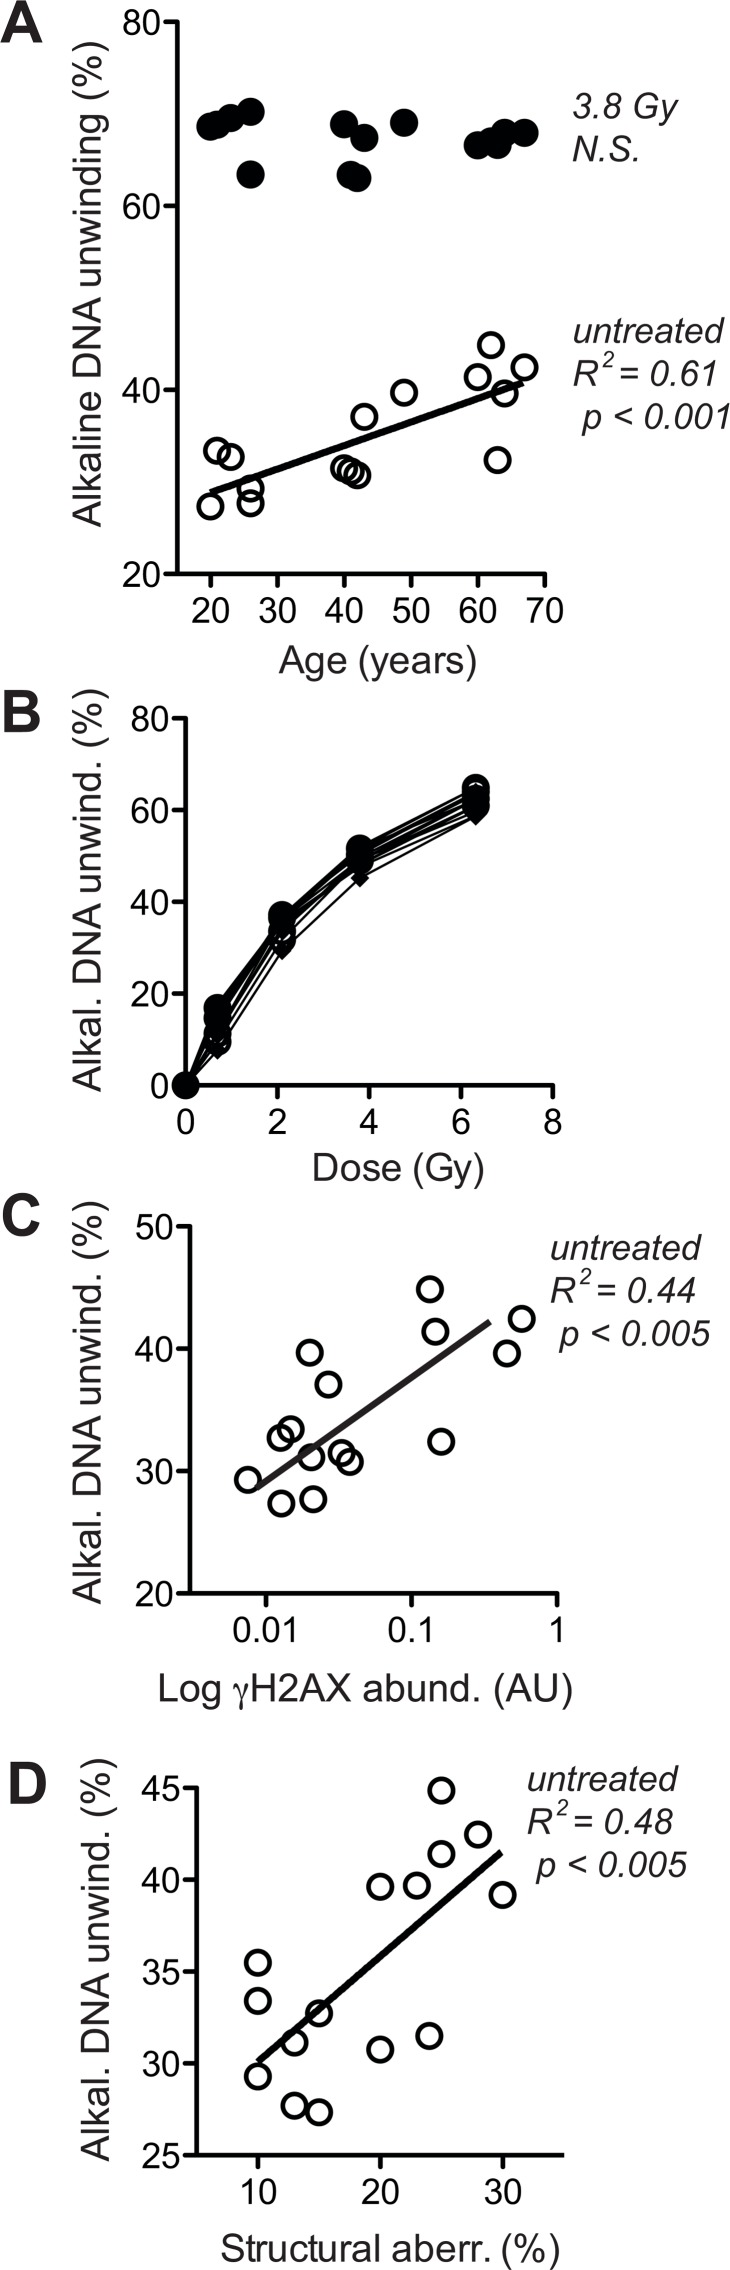
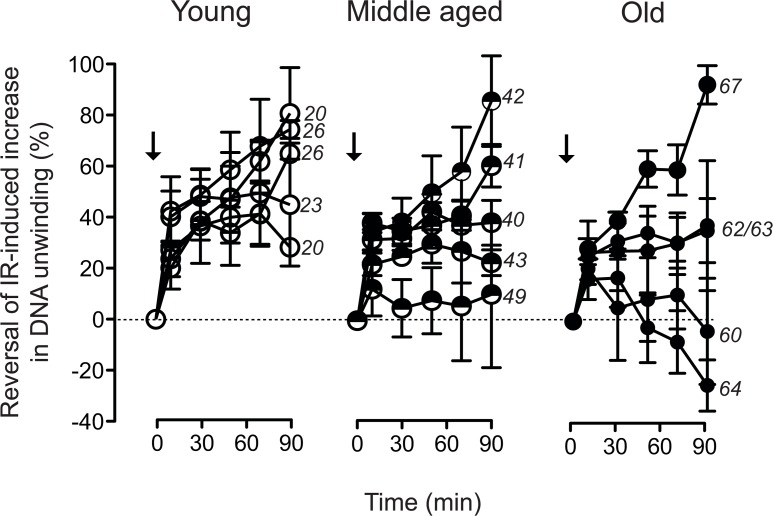
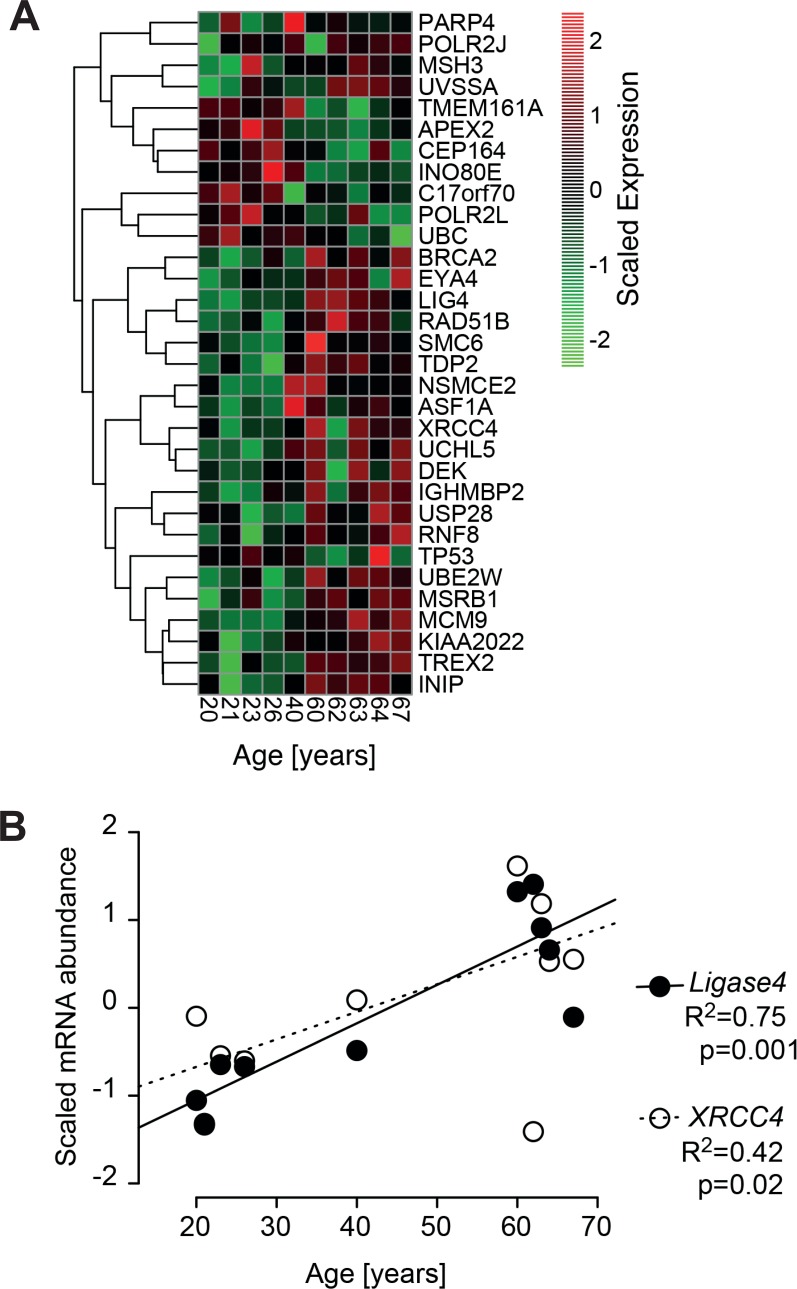
Dermal fibroblasts provide a paradigmatic model of cellular adaptation to long-term exogenous stress and ageing processes driven thereby. Here we addressed whether fibroblast ageing analysedex vivo entails genome instability. Dermal fibroblasts from human female donors aged 20-67 years were studied in primary culture at low population doubling. Under these conditions, the incidence of replicative senescence and rates of age-correlated telomere shortening were insignificant. Genome-wide gene expression analysis revealed age-related impairment of mitosis, telomere and chromosome maintenance and induction of genes associated with DNA repair and non-homologous end-joining, most notably XRCC4 and ligase 4. We observed an age-correlated drop in proliferative capacity and age-correlated increases in heterochromatin marks, structural chromosome abnormalities (deletions, translocations and chromatid breaks), DNA strand breaks and histone H2AX-phosphorylation. In a third of the cells from old and middle-aged donors repair of X-ray induced DNA strand breaks was impaired despite up-regulation of DNA repair genes. The distinct phenotype of genome instability, increased heterochromatinisation and (in 30% of the cases futile) up-regulation of DNA repair genes was stably maintained over several cell passages indicating that it represents a feature of geroconversion that is distinct from cellular senescence, as it does not encompass a block of proliferation.


Conflict of interest statement

Conflict of interest statement

The authors have no conflict of interests to declare.

Figures

Figure 1
Figure 1. GSEA analysis of age-related regulation of genes associated with genome maintenance
(A) Principal component analysis of the donor transcriptomes. Samples of the same age group are enclosed by a convex hull to mark the overlap and separation of these groups. (B) The heatmaps depict the gene set enrichment analysis of gene sets related to cell cycle, senescence, telomere and DNA repair, which are up- or down-regulated with age (p-value < 0.1 in at least one donor). Heatmap colours correspond to the –log10 transformed p-values. Depicted expression values are row-wise mean centred and scaled to unit variance. Genes and samples (rows and columns, respectively) have been hierarchically clustered using complete linkage. Complete data files of GSEA are provided in [20].
Figure 2
Figure 2. Cell proliferation and heterochromatin marks
(A) Mean ± SEM of population doublings (PD) per 24 h determined for each donor in five to six independent cultures by seeding a defined amount of cells onto a standardised area of substratum and monitoring the time required for growth to confluency and the final cell yield. Results of linear regression are stated as R2: Pearson's coefficient for goodness of fit, p: probability for slope = 0, dotted lines: 95% confidence limits of linear regression, and N.S.: linear regression of the data revealed no significant age-related change in the parameters. (B) Heterochromatin marks HP1β (left) and mH2A (right) determined by immunoblotting in whole cell lysates of dermal fibroblasts from the young (open symbols) and old donor group (closed symbols) at PD < 14. Data were normalised to values obtained in control fibroblasts subjected to replicative senescence. Data points represent means of triplicate determinations in separate cell cultures. Errors were < 30% of the values and are omitted for the sake of clarity. Horizontal lines indicate the mean of the respective age group. Numbers next to data points indicate the chronological age of the respective donor.
Figure 3
Figure 3. Structural and numerical chromosome aberrations
A total of 40 metaphases prepared from two independent cultures were evaluated by G-banding. For a given mitosis, all chromosome aberrations observed therein were listed. (A) Examples of structural (1a, b) and numerical (2) chromosome aberrations listed during scoring. (B) Frequency of all aberrations evaluated as the percentage of cells (mitoses) positive for one or more aberrations plotted over calendar age of the donors. (C) Number of individual aberrations within an altered mitosis plotted over calendar age of the donors. (D) Frequency of structural aberrations plotted over donor age. (E) Frequency of numerical aberrations plotted over donor age. (B-E) Mean values obtained for each donor; SEM < 20% of the values omitted for the sake of clarity; results of linear regression are stated as R2: Pearson's coefficient for goodness of fit, p: probability for slope = 0, dotted lines: 95% confidence limits of linear regression, and N.S.: linear regression of the data revealed no significant age-related change in the parameters.
Figure 4
Figure 4. DSB-related DDR
(A) H2AX phosphorylation was determined in dermal fibroblasts by immune blotting [46] without (open circles) and with (closed circles) pre-treatment with 50 μm VP16. Mean data of three independent cultures, SEM < 20% of the mean is omitted for the sake of clarity. (B) Cross-comparison of base line H2AX phosphorylation (in the absence of VP16, same data as represented by open symbols in section A of this figure) and frequency of structural chromosome aberrations (same data as shown in Fig. 3 D). (A, B) Results of linear regression are stated as R2: Pearson's coefficient for goodness of fit, p: probability for slope = 0, dotted lines: 95% confidence limits of linear regression, and N.S.: linear regression of the data revealed no significant age-related change in the parameters.
Figure 5
Figure 5. Levels of DNA strand breaks at base line and following IR exposure
(A) Fluorimetric quantitation of alkaline DNA unwinding carried out with lysates of untreated cells (open circles) and cells exposed to 3.8 Gy (closed circles). Values are normalised to total signal intensity corresponding to non-unwound DNA. (B) IR-dose-response curves determined as in (A). (C) Cross-comparison of base line H2AX phosphorylation (in the absence of VP16, same data as represented by open symbols in Fig. 4A) and base line alkaline DNA unwinding in the absence of IR (same data as open circles in section A of this figure). (D) Cross-comparison of structural chromosome aberrations (same data as in Fig. 3D) and base line alkaline DNA unwinding in the absence of IR (same data as open circles in section A of this figure). (A, C, D) Results of linear regression are stated as R2: Pearson's coefficient for goodness of fit, p: probability for slope = 0, and N.S.: no significant correlation. Data represent mean values of five independent cell cultures per donor, each analysed in four technical replicates. SEM was in all cases less than 20% of the values and is omitted for the sake of clarity.
Figure 6
Figure 6. Trajectories of DNA strand break repair
Alkaline DNA unwinding was monitored in cell lysates prepared at the indicated time points subsequent to exposure of the cells to 3.8 Gy (arrows). Values are normalised to the amplitude of the initial IR-induced increase in unwinding. Data represent mean values ± SEM of five independent cell cultures analysed for each individual donor. Numbers on the right margins of the age groups indicate the chronological ages of the donors of the samples.
Figure 7
Figure 7. Age-correlated regulation of DNA-repair genes
(A) Heatmap of significant age-associated changes in genes associated with DNA-repair. The heatmap depicts all genes that are significantly changing with age according to a robust linear regression (p-value < 0.1, R2 > 0.4). The gene list is compiled from 405 genes annotated with DNA repair processes. Depicted expression values are gene-wise mean centred and scaled to unit variance across all samples and hierarchically clustered using complete linkage. Four donors from the middle aged group having a large body mass index and being outliers in the PCA (Fig.1A) have been excluded from the analysis. (B) Signal intensities of Agilent array probes representing Ligase 4 (closed circles) and XRCC4 (open circles) plotted over calendar age of the donors. Signal intensities were quantile normalized across all samples and input data were subjected to baseline transformation to the median of all samples. Results of linear regression are stated as R2: fraction of variance explained by the linear model, p: probability for slope = 0.

References

    1. Boukamp P. Skin aging: a role for telomerase and telomere dynamics? Curr Mol Med. 2005;5:171–177. - PubMed
    1. Tigges J, Krutmann J, Fritsche E, Haendeler J, Schaal H, Fischer JW, Kalfalah F, Reinke H, Reifenberger G, Stuhler K, Ventura N, Gundermann S, Boukamp P, et al. The hallmarks of fibroblast ageing. Mech Ageing Dev. 2014;138:26–44. - PubMed
    1. Schulze C, Wetzel F, Kueper T, Malsen A, Muhr G, Jaspers S, Blatt T, Wittern KP, Wenck H, Kas JA. Stiffening of human skin fibroblasts with age. Clin Plast Surg. 2012;39:9–20. - PubMed
    1. Boraldi F, Bini L, Liberatori S, Armini A, Pallini V, Tiozzo R, Pasquali-Ronchetti I, Quaglino D. Proteome analysis of dermal fibroblasts cultured in vitro from human healthy subjects of different ages. Proteomics. 2003;3:917–929. - PubMed
    1. Kueper T, Grune T, Prahl S, Lenz H, Welge V, Biernoth T, Vogt Y, Muhr GM, Gaemlich A, Jung T, Boemke G, Elsasser HP, Wittern KP, et al. Vimentin is the specific target in skin glycation. Structural prerequisites, functional consequences, and role in skin aging. J Biol Chem. 2007;282:23427–23436. - PubMed

Publication types