. 2015 Feb 27;347(6225):1010-4.
doi: 10.1126/science.1259418. Epub 2015 Feb 12.

Transcribed enhancers lead waves of coordinated transcription in transitioning mammalian cells

Erik ArnerCarsten O DaubKristoffer Vitting-SeerupRobin AnderssonBerit LiljeFinn DrabløsAndreas LennartssonMichelle RönnerbladOlga HrydziuszkoMorana VitezicTom C FreemanAhmad M N AlhendiPeter ArnerRichard AxtonJ Kenneth BaillieAnthony BeckhouseBeatrice BodegaJames BriggsFrank BrombacherMargaret DavisMichael DetmarAnna EhrlundMitsuhiro EndohAfsaneh EslamiMichela FagioliniLynsey FairbairnGeoffrey J FaulknerCarmelo FerraiMalcolm E FisherLesley ForresterDaniel GoldowitzReto GulerThomas HaMitsuko HaraMeenhard HerlynTomokatsu IkawaChieko KaiHiroshi KawamotoLevon M KhachigianS Peter KlinkenSoichi KojimaHaruhiko KosekiSarah KleinNiklas MejhertKen MiyaguchiYosuke MizunoMitsuru MorimotoKelly J MorrisChristine MummeryYutaka NakachiSoichi OgishimaMariko Okada-HatakeyamaYasushi OkazakiValerio OrlandoDmitry OvchinnikovRobert PassierMargaret PatrikakisAna PomboXian-Yang QinSugata RoyHiroki SatoSuzana SavviAlka SaxenaAnita SchwegmannDaisuke SugiyamaRolf SwobodaHiroshi TanakaAndru TomoiuLouise N WinteringhamErnst WolvetangChiyo Yanagi-MizuochiMisako YonedaSusan ZabierowskiPeter ZhangImad AbugessaisaNicolas BertinAlexander D DiehlShiro FukudaMasaaki FurunoJayson HarshbargerAkira HasegawaFumi HoriSachi Ishikawa-KatoYuri IshizuMasayoshi ItohTsugumi KawashimaMiki KojimaNaoto KondoMarina LizioTerrence F MeehanChristopher J MungallMitsuyoshi MurataHiromi Nishiyori-SuekiSerkan SahinSayaka Nagao-SatoJessica SeverinMichiel J L de HoonJun KawaiTakeya KasukawaTimo LassmannHarukazu SuzukiHideya KawajiKim M SummersChristine WellsFANTOM ConsortiumDavid A HumeAlistair R R ForrestAlbin SandelinPiero CarninciYoshihide Hayashizaki

Transcribed enhancers lead waves of coordinated transcription in transitioning mammalian cells

Erik Arner et al. Science. .

Abstract

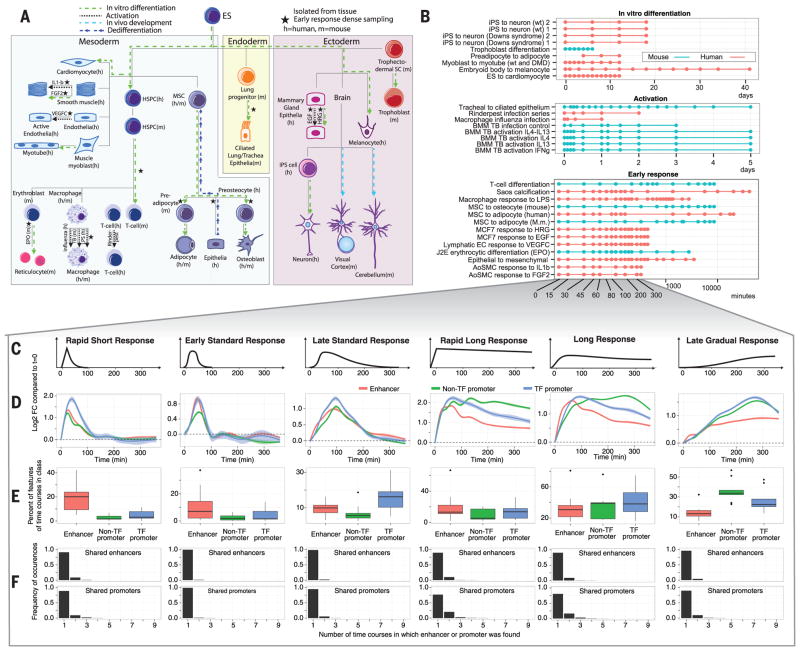
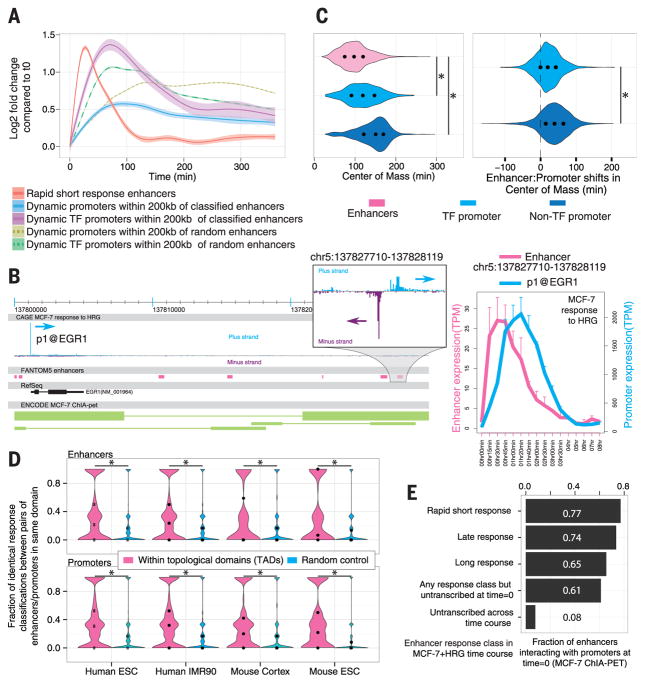
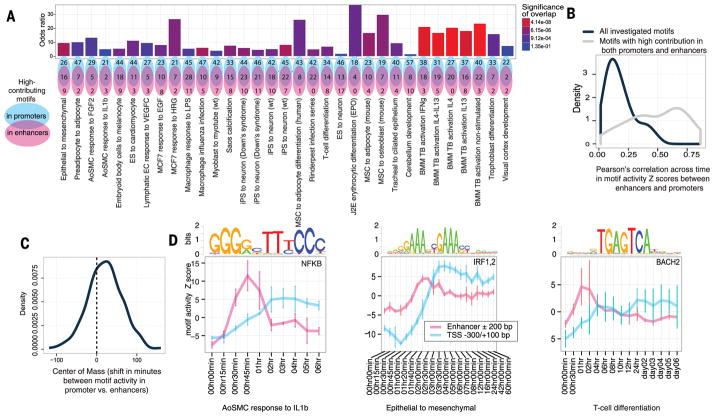
Although it is generally accepted that cellular differentiation requires changes to transcriptional networks, dynamic regulation of promoters and enhancers at specific sets of genes has not been previously studied en masse. Exploiting the fact that active promoters and enhancers are transcribed, we simultaneously measured their activity in 19 human and 14 mouse time courses covering a wide range of cell types and biological stimuli. Enhancer RNAs, then messenger RNAs encoding transcription factors, dominated the earliest responses. Binding sites for key lineage transcription factors were simultaneously overrepresented in enhancers and promoters active in each cellular system. Our data support a highly generalizable model in which enhancer transcription is the earliest event in successive waves of transcriptional change during cellular differentiation or activation.


Figures

Fig. 1
Fig. 1. Time course design and definition of response classes
(A) Schematic illustration of the time course experiments included in the study, arranged according to a development tree. Germ layers are shown as boxes. Black stars indicate time series sampled with high resolution. (B) Overview of time courses according to sampling strategy. The x axis indicates time after induction. Each dot indicates CAGE sampling, typically done in biological triplicates. (C) Stylistic representation of each of the major up-regulated response patterns (classes) identified as described in the main text. The y axis shows log2 fold change versus time 0; the x axis shows time in minutes. (D) Mean expression log2 fold change across time courses for enhancers and promoters classified into each response pattern [as in (C)]. The 95% confidence intervals of means are shown. (E) Boxplots of fractions showing the preference for enhancers, TF promoters, and other promoters for respective response class. (F) Overlap between time courses in terms of enhancers and promoters in respective class. Barplots show the frequency (y axis) of the number of time courses (out of 9) sharing a specific feature (x axis).
Fig. 2
Fig. 2. Temporal shifts between enhancer and promoter activity
(A) Smoothed mean expression over time for all enhancers classified into the rapid short response group and all differentially expressed proximal (±200 kb) promoters, split by gene type. Controls for class specificity (dotted lines) constitute promoters proximal to randomly sampled enhancers from other classes. Shaded areas indicate 95% confidence intervals. (B) Example of expression timing in an enhancer-promoter pair (EGR1), showing activation of enhancers before promoter activation. MCF-7 ChIA-PET interaction data are visualized at the bottom as green lines; each line represents a cluster of ChIA-PET paired tags consisting of at least three pairs, where line end thickness is proportional to the number of paired tags in the cluster. Right panel shows the expression level of promoter and enhancer in MCF-7 cells after induction with HRG. Error bars indicate SD. (C) Left: Distribution of center of mass (CM) of expression changes (see main text) for enhancers, TF promoters, and promoters of other genes. Right: difference in CM (“shift”) between enhancers-promoter pairs linked by proximity (±200 kb) split by gene type. Black dots indicate 25th, 50th, and 75th percentiles. Asterisks indicate significance (P < 1.0 × 10−106, Mann-Whitney U test). (D) The similarity of enhancer or promoter response classification (Fig. 1C) within each TAD was analyzed by calculating the frequency of identically classified enhancers or promoters in all pairwise comparisons. Frequency distributions are shown as violin plots. Controls are made by randomly sampling the same number of enhancers or promoters and calculating the classification similarity as above (repeated 100 times for each TAD). Asterisks indicate significance (P < 0.01, Mann-Whitney U test); dots represent percentiles, as in (C). (E) Fraction of enhancers that interact (by RNAPII-ChIA-PET) with promoters in unstimulated MCF-7 cells, split by enhancer response class in the MCF-7+HRG time course.
Fig. 3
Fig. 3. Motif analysis of linked enhancers and promoters over time
(A) Overlap of motifs classified as significant for driving expression in enhancers and promoters. Top row: bar plot of motif overlap odds ratios, colored by significance. Bottom row: Venn diagrams of motif set overlap. (B) Distributions of average Pearson correlation coefficient between motif activities in enhancers and promoters in all motifs investigated (black) and motifs significantly active in both enhancers and promoters (gray). (C) Distribution of shift (minutes) in motif activity center of mass (see Fig. 2D) in promoters compared to enhancers. (D) Examples of motif activity in enhancers preceding that of promoters. Motif activity is plotted as the average of activity Z scores per time point. Error bars indicate the SD.

References

    1. Levine M, Cattoglio C, Tjian R. Cell. 2014;157:13–25. - PMC - PubMed
    1. Bonn S, et al. Nat Genet. 2012;44:148–156. - PubMed
    1. Nord AS, et al. Cell. 2013;155:1521–1531. - PMC - PubMed
    1. Stergachis AB, et al. Cell. 2013;154:888–903. - PMC - PubMed
    1. Kim TK, et al. Nature. 2010;465:182–187. - PMC - PubMed

Publication types