

Navigator-3, a modulator of cell migration, may act as a suppressor of breast cancer progression
- PMID: 25678558
- PMCID: PMC4364947
- DOI: 10.15252/emmm.201404134
Navigator-3, a modulator of cell migration, may act as a suppressor of breast cancer progression
Abstract
Dissemination of primary tumor cells depends on migratory and invasive attributes. Here, we identify Navigator-3 (NAV3), a gene frequently mutated or deleted in human tumors, as a regulator of epithelial migration and invasion. Following induction by growth factors, NAV3 localizes to the plus ends of microtubules and enhances their polarized growth. Accordingly, NAV3 depletion trimmed microtubule growth, prolonged growth factor signaling, prevented apoptosis and enhanced random cell migration. Mathematical modeling suggested that NAV3-depleted cells acquire an advantage in terms of the way they explore their environment. In animal models, silencing NAV3 increased metastasis, whereas ectopic expression of the wild-type form, unlike expression of two, relatively unstable oncogenic mutants from human tumors, inhibited metastasis. Congruently, analyses of > 2,500 breast and lung cancer patients associated low NAV3 with shorter survival. We propose that NAV3 inhibits breast cancer progression by regulating microtubule dynamics, biasing directionally persistent rather than random migration, and inhibiting locomotion of initiated cells.
Keywords: cancer; cell migration; cytoskeleton; growth factor; microtubules.
© 2015 The Authors. Published under the terms of the CC BY 4.0 license.
Figures
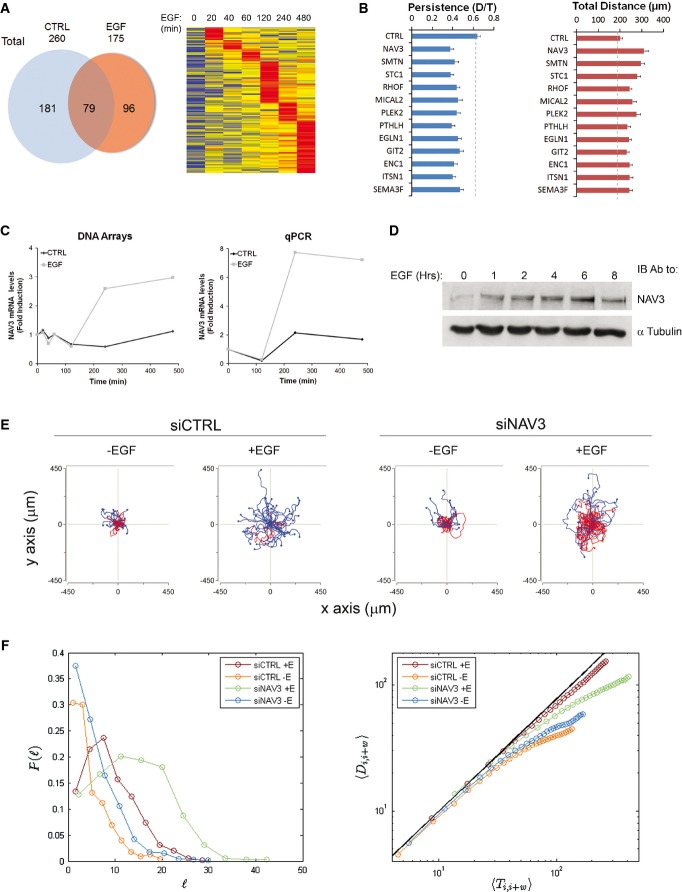
The results of oligonucleotide array screens of EGF- or control-stimulated MCF10A cells (Amit et al, 2007) were re-analyzed, and genes induced by > twofold were included in the Venn diagram. The heatmap presents a time series of genes induced upon EGF treatment.
siRNAs specific to the indicated genes were used to treat MCF10A cells, and migration tracks were subsequently quantified (see Supplementary Fig S1A). Shown are means ± SEM of three experiments; 60 cells were analyzed in each case. The results of statistical analyses (two-tailed Student's t-test) are shown in Supplementary Table S1.
Changes in NAV3 expression levels in response to EGF were extracted from DNA arrays or determined by means of quantitative PCR.
Serum-starved MCF10A cells were treated with EGF (10 ng/ml) for the indicated time intervals, and cell extracts were subjected to immunoblotting (IB), as indicated.
Shown are trajectories of MCF10A cells expressing either siCTRL or siNAV3 and migrated on collagen in the absence or presence of EGF. Red tracks indicate low persistence (< 0.3). See quantification of the data in Supplementary Fig S2D.
Quantitative analysis of the mode of migration of NAV3-depleted cells. The distribution of step sizes was computed, normalized and presented as probability distribution functions (left panel). Log-log plots indicating modes of migration for each of the four conditions are shown (right panel). Note that only EGF-treated siCTRL cells exhibit a persistent walk (diagonal), whereas the other three asymptote, as expected for random walks.
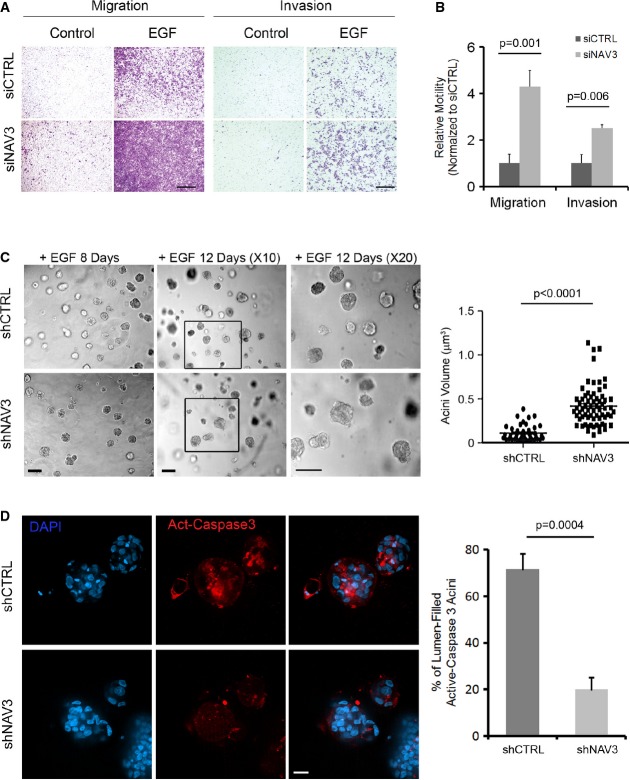
MCF10A cells, pre-transfected with the indicated siRNAs, were assayed for migration or invasion in the absence or presence of EGF. Cells that reached the filter's bottom were stained and photographed. Scale bars, 150 μm (migration) and 100 μm (invasion).
The results from (A) are depicted as means ± SD (four experiments).
Phase microscopy analysis of shCTRL and shNAV3 MCF10A cells (scale bars, 50 μm), which were plated in Matrigel and grown for 8 or 12 days in the presence of EGF (20 ng/ml). Acini were photographed and quantified for their volumes using ImageJ. The right panel shows analysis of acinus size after 8 days in culture (data represent three different experiments, and P-value was calculated using t-test).
shCTRL or shNAV3 acini (day 10) were immunostained for activated caspase-3 (red) and DAPI (scale bar, 20 μm). Clusters positive for activated caspase-3 were counted and quantified in three experiments (means ± SD).
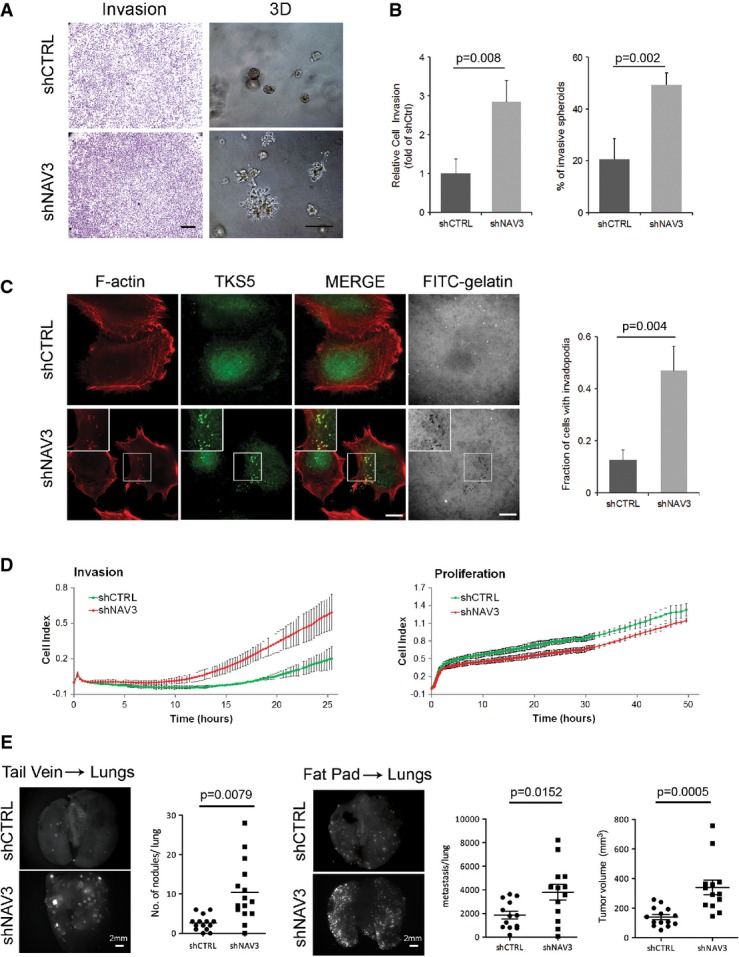
shCTRL- and shNAV3-MDA-MB-231 cells were plated in invasion chambers, and 18 h later, invaded cells were stained. For 3D growth, cells were seeded in Matrigel and photos were taken 5 days later (scale bars, 200 μm and 50 μm).
Histograms (means ± SD) of the results presented in (A) (from three experiments).
MDA-MB-231 derivatives were plated on coverslips pre-coated with a fluorescent gelatin. Two hours later, cells were probed for actin and TKS5. The number of cells with invadopodia were quantified in three experiments. Shown are means ± SD. Each determination included 80 cells. Scale bar, 10 μm.
MDA-MB-231 derivatives were monitored for invasion and proliferation using real-time impedance (xCELLigence).
The indicated RFP-expressing MDA-MB-231 derivatives were injected either intravenously (1.5 × 10⁵ per mouse; tail vein), or into the mammary fat pad (2.5 × 10⁶ cells per mouse) of SCID mice. Four weeks later, lungs from the tail vein-injected mice were photographed and examined for RFP signals corresponding to relatively large nodules, which were quantified. Photographs and numbers of the relatively small metastases, as well as tumor size from mice injected into the fat pad, were obtained 8 weeks post-implantation (right panels).
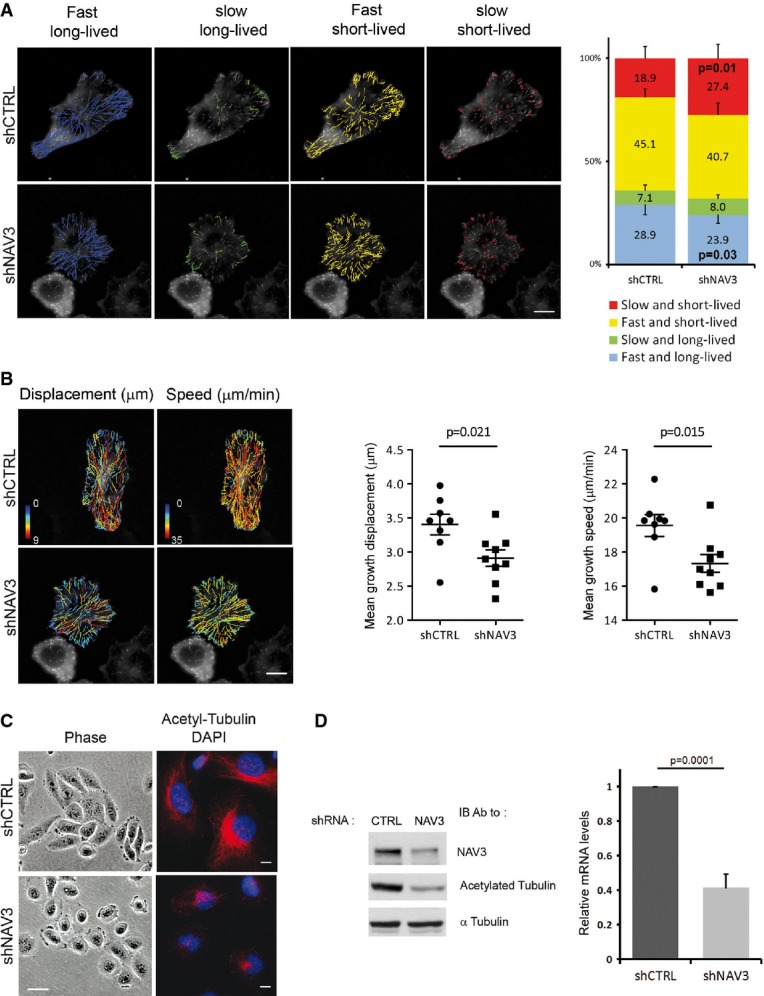
The indicated MDA-MB-231 derivatives were transfected with a GFP-EB1 plasmid. Time-lapse images were taken at 2-s intervals, and MT ends were tracked using plusTipTracker. Overlays of four MT subpopulations and representative cells are shown (scale bar, 10 μm), along with the relative proportions of subpopulations (right panel). Data (mean ± SD) were pooled from three experiments. P-values are shown for two groups.
Cells from (A) were used to derive representative overlays of MT dynamics maps, depicting displacement and speed (scale bar, 10 μm). Scatter plots of mean displacement and speed of MT tracks are shown. Nine representative cells (three of each experiment) were selected for analysis of MT's mean displacement and speed.
The indicated derivatives of MDA-MB-231 cells were photographed, either directly or following immunofluorescence analysis using the indicated antibodies. Nuclei were stained with DAPI (scale bars, 20 μm and 10 μm, left and right columns, respectively).
The indicated stable derivatives of MDA-MB-231 cells were analyzed using RT–PCR for the levels of NAV3 expression (right panel). Shown are means ± SD from three independent analyses. Whole-cell extracts were prepared and subjected to immunoblotting with anti-NAV3, anti-acetylated tubulin and anti-α-tubulin antibodies (left panel).
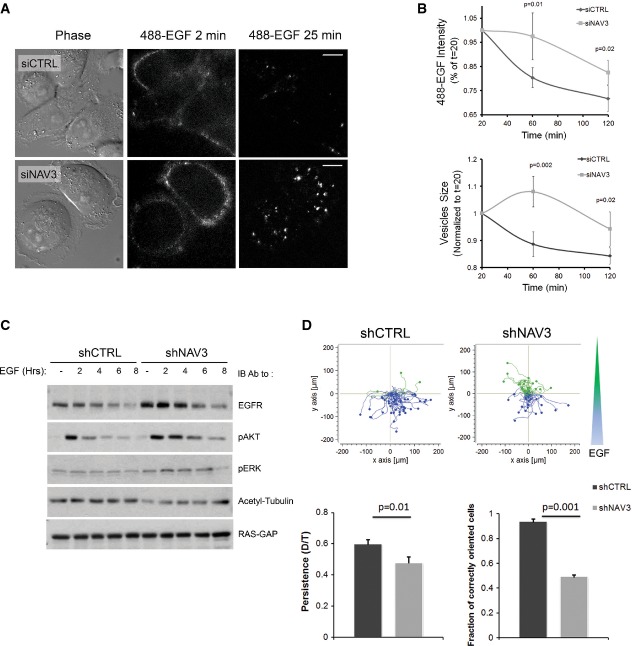
MDA-MB-231 cells, pre-treated with the indicated siRNAs, were stimulated with Alexa Fluor 488-EGF (20 ng/ml) and imaged for 25 min. Frames taken at 2 and 25 min are shown (scale bars, 10 μm; see Supplementary Movie S3).
Cells were stimulated with EGF (20 ng/ml; 10 min) as in (A), acid-washed and incubated at 37°C for the indicated intervals. Thereafter, cells were detached, fixed and analyzed using imaging flow cytometry (ImageStreamX). Shown are means ± SD from three experiments.
MDA-MB-231 derivatives were serum-starved and stimulated with EGF for the indicated time intervals. Whole extracts were subjected to immunoblotting as indicated.
Rose plots obtained with MDA-MB-231 derivatives exposed to an EGF gradient (shown as a blue and green wedge) in chemotaxis chambers. Blue lines indicate properly oriented tracks. Histograms (mean ± SEM) show quantification of persistence and chemotactic orientation from three experiments (45 cells).
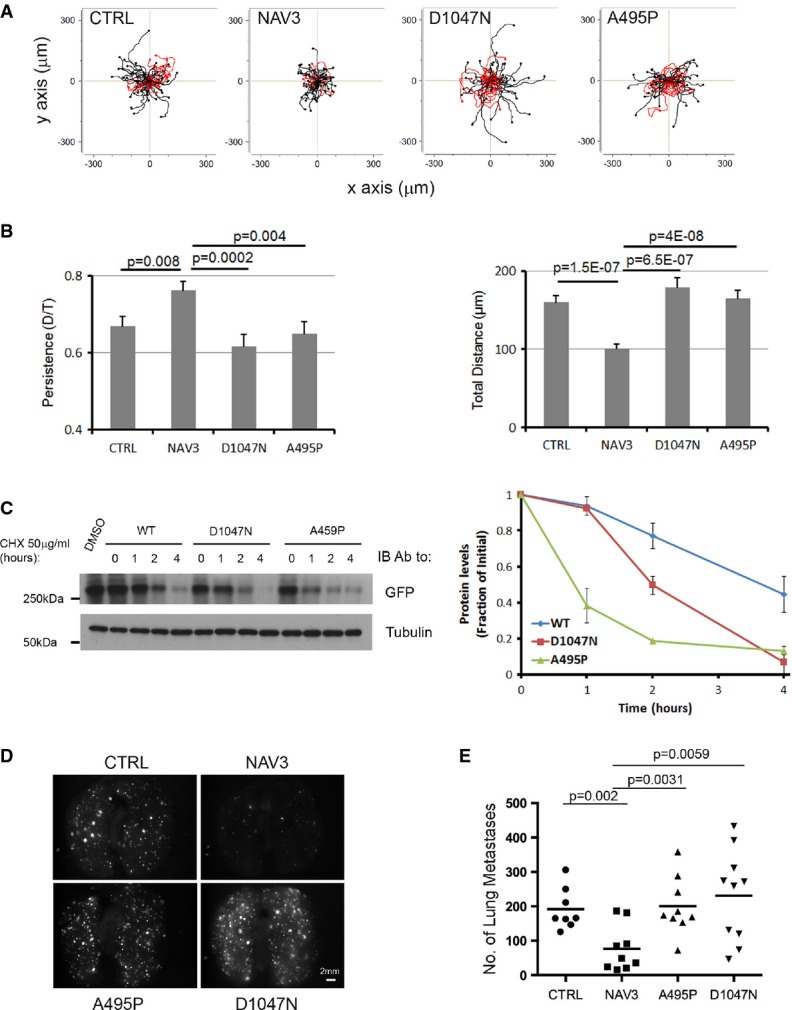
A MCF10A cells were plated on collagen, and 24 h later, they were treated with EGF (10 ng/ml). Shown are trajectories of cells transiently expressing the indicated forms of NAV3. Red tracks indicate relatively low persistence (< 0.6).
B Quantification of migration parameters (from A) is shown as mean ± SEM (60 cells and three experiments).
C HEK293 cells previously transfected with EGFP-NAV3 (WT), EGFP-NAV3-D1047N or EGFP-NAV3-A459P were treated with cycloheximide (CHX; 50 μg/ml) or with the solvent, DMSO, for the indicated time intervals, followed by cell lysis and immunoblotting using anti-EGFP and anti-α-tubulin antibodies. The signals obtained were quantified and normalized to time zero (untreated cells; right panel).
D, E The indicated mCherry-expressing MDA-MB-231 derivatives were injected intravenously (1.5 × 10⁵ per mouse) using 5-week-old female SCID mice. Four weeks later, lungs were photographed and the numbers of lung metastases were determined.
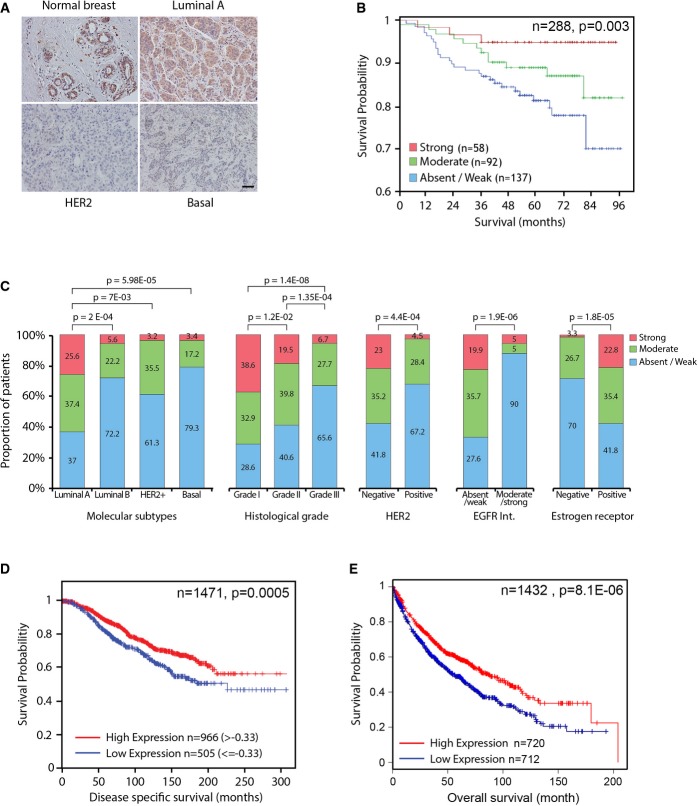
A Representative immunohistochemistry images of NAV3 in a normal breast tissue, as well as in the indicated molecular subtypes of breast cancer.
B Tissue microarrays were used to stratify 288 breast cancer patients for overall survival according to NAV3 abundance.
C Immunohistochemistry was used to score NAV3 expression and stratify 323 breast cancer patients according to the indicated subtypes and tumor parameters.
D, E Kaplan–Meier curves depicting survival of 1,471 estrogen receptor-positive breast cancer patients (D) and 1,405 lung cancer patients (E) stratified according to NAV3 abundance.
References
-
- Akhmanova A, Steinmetz MO. Tracking the ends: a dynamic protein network controls the fate of microtubule tips. Nat Rev Mol Cell Biol. 2008;9:309–322. - PubMed
-
- Amit I, Citri A, Shay T, Lu Y, Katz M, Zhang F, Tarcic G, Siwak D, Lahad J, Jacob-Hirsch J, et al. A module of negative feedback regulators defines growth factor signaling. Nat Genet. 2007;39:503–512. - PubMed
-
- Avraham R, Sas-Chen A, Manor O, Steinfeld I, Shalgi R, Tarcic G, Bossel N, Zeisel A, Amit I, Zwang Y, et al. EGF decreases the abundance of microRNAs that restrain oncogenic transcription factors. Sci Signal. 2010;3:ra43. - PubMed
Publication types
MeSH terms
Substances
Grants and funding
LinkOut - more resources
Full Text Sources
Other Literature Sources
Medical
Molecular Biology Databases
