. 2015 Apr;3(4):399-411.
doi: 10.1158/2326-6066.CIR-14-0215. Epub 2015 Feb 12.

Induction of T-cell Immunity Overcomes Complete Resistance to PD-1 and CTLA-4 Blockade and Improves Survival in Pancreatic Carcinoma

Affiliations

Induction of T-cell Immunity Overcomes Complete Resistance to PD-1 and CTLA-4 Blockade and Improves Survival in Pancreatic Carcinoma

Rafael Winograd et al. Cancer Immunol Res. 2015 Apr.

Abstract

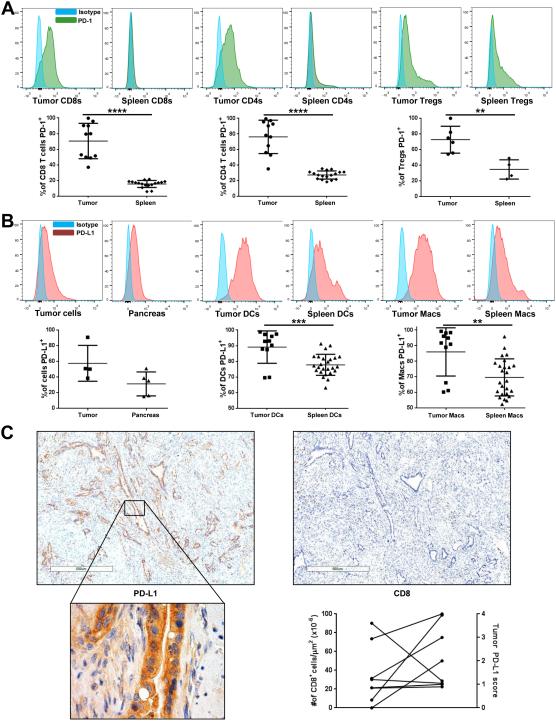
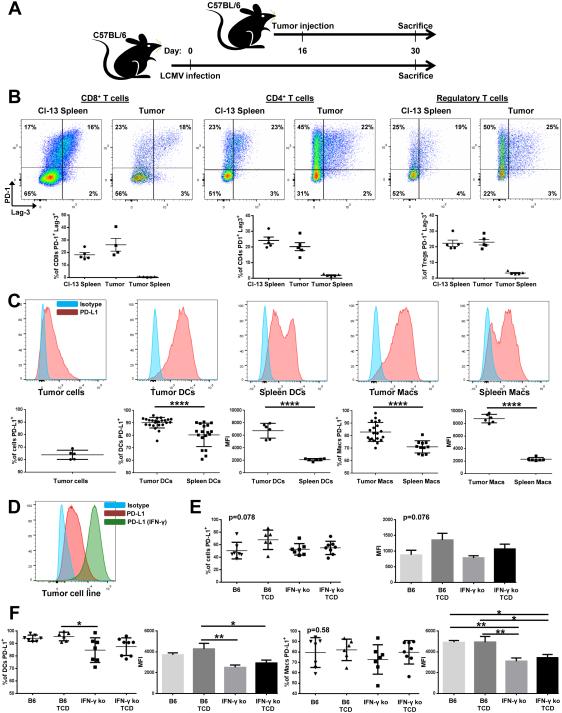
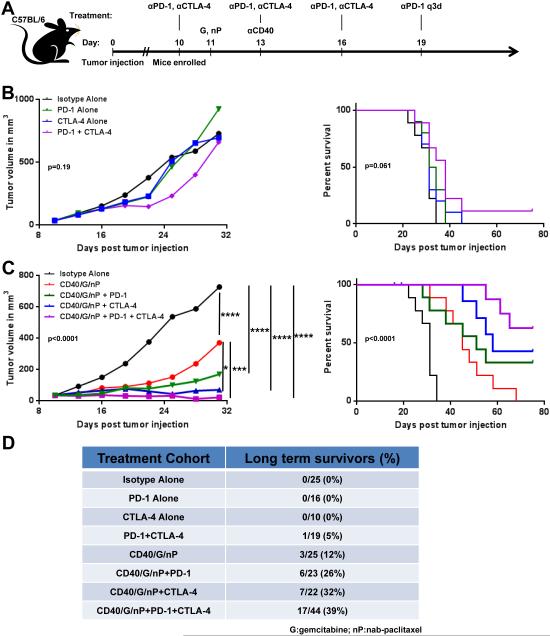
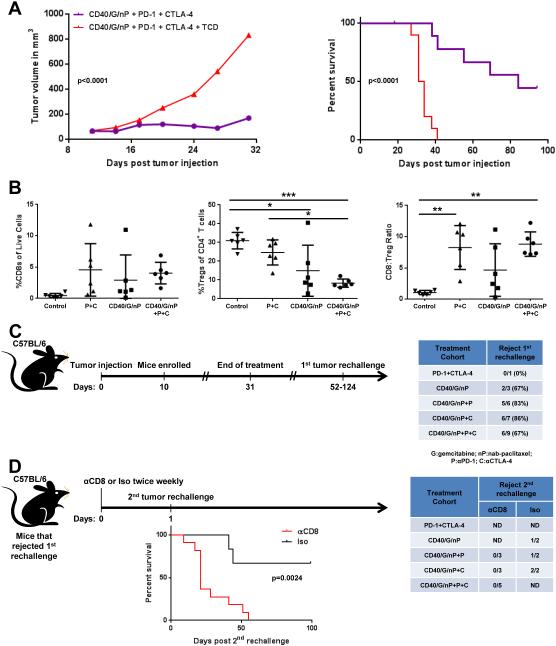
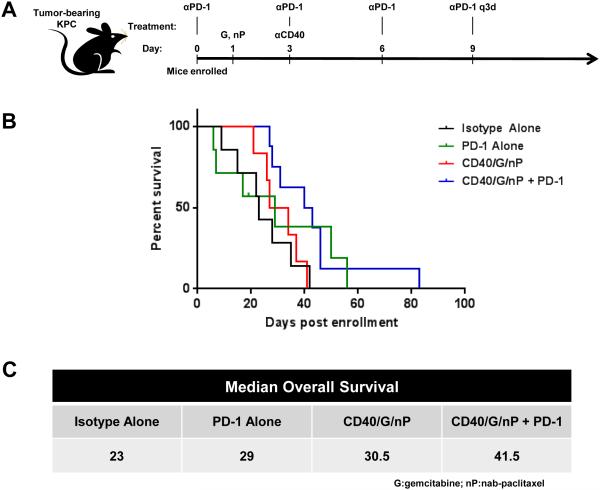
Disabling the function of immune checkpoint molecules can unlock T-cell immunity against cancer, yet despite remarkable clinical success with monoclonal antibodies (mAb) that block PD-1 or CTLA-4, resistance remains common and essentially unexplained. To date, pancreatic carcinoma is fully refractory to these antibodies. Here, using a genetically engineered mouse model of pancreatic ductal adenocarcinoma in which spontaneous immunity is minimal, we found that PD-L1 is prominent in the tumor microenvironment, a phenotype confirmed in patients; however, tumor PD-L1 was found to be independent of IFNγ in this model. Tumor T cells expressed PD-1 as prominently as T cells from chronically infected mice, but treatment with αPD-1 mAbs, with or without αCTLA-4 mAbs, failed in well-established tumors, recapitulating clinical results. Agonist αCD40 mAbs with chemotherapy induced T-cell immunity and reversed the complete resistance of pancreatic tumors to αPD-1 and αCTLA-4. The combination of αCD40/chemotherapy plus αPD-1 and/or αCTLA-4 induced regression of subcutaneous tumors, improved overall survival, and conferred curative protection from multiple tumor rechallenges, consistent with immune memory not otherwise achievable. Combinatorial treatment nearly doubled survival of mice with spontaneous pancreatic cancers, although no cures were observed. Our findings suggest that in pancreatic carcinoma, a nonimmunogenic tumor, baseline refractoriness to checkpoint inhibitors can be rescued by the priming of a T-cell response with αCD40/chemotherapy.


Figures

Figure 1
Figure 1. Expression of PD-1 and PD-L1 in murine and human PDA
(A) Representative histograms and quantification of PD-1 expression on tumor-infiltrating CD8+ (gated on live, CD45+, CD3+, CD8+), CD4+ (gated on live, CD45+, CD3+, CD4+), or regulatory (Tregs; gated on live, CD45+, CD3+, CD4+, FoxP3+) T cells in tumors (n=6-11) or spleens (n=4-17) from tumor-bearing KPC mice. **p≤ 0.01, ****p≤ 0.0001. (B) Representative histograms and quantification of PD-L1 expression on tumor cells, normal pancreatic epithelial cells (gated on live, CD45neg, CD31neg, CD90neg), dendritic cells (DCs; gated on live, CD45+, F4/80neg, CD19neg, CD11c+), and macrophages (Macs; gated on live, CD45+, F4/80+) in tumors (n=4-11) or spleens (n=25) from tumor-bearing KPC mice; and normal pancreata (n=5) from healthy C57BL/6 mice. **p≤ 0.01, ***p≤ 0.001. (C) Histology and quantification of PD-L1 expression and CD8+ T-cell infiltration in human pancreatic cancer sections. Left two panels, PD-L1 expression on malignant cells of a PDA tumor (PD-L1 expression score of 4+ (intense), see Materials and Methods and Supplementary Fig. S1; 40x and 400x magnification for top and bottom panels, respectively). Right top panel, CD8 expression in serial section of the tumor in left panel, demonstrating few tumor-infiltrating CD8+ T cells (40x magnification). Right bottom panel, plot describing correlation between intratumoral CD8 count and tumor PD-L1 score (n=8). p=0.69.
Figure 2
Figure 2. PD-1/PD-L1 axis is highly expressed and is not IFNγ-dependent in a subcutaneous murine model of PDA
(A) Experimental design for establishment of subcutaneous PDA tumors or chronic LCMV clone 13 (Cl-13) infection simultaneously in 2 cohorts of C57BL/6 mice. (B) Representative flow plots and quantification of co-expression of PD-1 and Lag-3 on CD8+ (gated on live, lymphocytes, B220neg, NK1.1neg, CD8+), CD4+ (gated on live, lymphocytes, B220neg, NK1.1neg, CD4+) and regulatory (Tregs; gated on live, lymphocytes, B220neg, NK1.1neg, CD4+, FoxP3+) T cells from spleens of mice infected with LCMV Cl-13 (day 30) or the tumors and spleens of mice bearing PDA tumors (day 14). (C) Representative histograms and quantification of PD-L1 expression on tumor cells, dendritic cells (DC), and macrophages (Mac) in subcutaneous PDA tumors or spleens from the same mice (day 14), gated as in Figure 1B. (MFI=mean fluorescence intensity). ****p≤ 0.0001. See also Supplementary Fig. S2. (D) Histogram of KPC-derived PDA cell line interrogated for PD-L1 expression in vitro with or without IFNγ in the culture, representative of 3 experiments. (E) Quantification and MFI of PD-L1 expression on tumor cells from subcutaneous PDA tumors established in either C57BL/6 (B6) or IFNγ−/− (IFNγ ko) mice with or without CD4+ and CD8+ T-cell depletion (TCD) (day 16; n=6-8 mice per cohort). (F) Quantification and MFI of PD-L1 expression on dendritic cells and macrophages in subcutaneous PDA tumors grown in either B6 or IFN-γ ko mice with or without TCD (day 16; n=6-8 mice per cohort). One-way ANOVA: %DCs PD-L1+, p=0.015; DC PD-L1 MFI, p=0.0039; %Macs PD-L1+, p=0.58; Macs PD-L1 MFI, p=0.0007. Post hoc test p values are indicated where statistically significant as *p≤ 0.05, **p≤ 0.01.
Figure 3
Figure 3. T-cell stimulation with αCD40/gemcitabine/nab-paclitaxel potentiates efficacy of checkpoint blockade in murine model of PDA
(A) Experimental design for experiments of subcutaneous PDA tumors treated with checkpoint inhibitors and αCD40/chemotherapy, as further described in Materials and Methods. (G=gemcitabine; nP=nab-paclitaxel; q3d= antibody administered every 3 days). (B) Tumor growth and survival analyses of mice bearing subcutaneous PDA tumors treated as indicated (n=9-10 per cohort; results for control and αPD-1+αCTLA-4 cohorts representative of 3 independent experiments). See also Supplementary Fig. S7. (C) Tumor growth and survival analyses of mice bearing subcutaneous PDA tumors treated as indicated (n=9-10 per cohort; findings representative of 3 independent experiments). Two-way ANOVA: p≤0.0001. Post hoc test p values indicated where statistically significant as *p≤ 0.05, ***p≤ 0.001, ****p≤ 0.0001. See also Supplementary Fig. S7. (D) Percentage of mice bearing subcutaneous PDA tumors treated with indicated regimens that rejected their tumors and survived tumor-free long-term (median follow-up of 42 days, range 23 to 222 days). Data compiled from 5 independent experiments.
Figure 4
Figure 4. Rejection of PDA tumors after αCD40/chemotherapy and checkpoint blockade is T cell-mediated
(A) Tumor growth and survival analyses of mice bearing subcutaneous PDA tumors treated as indicated (n=9-10 per cohort; G=gemcitabine; nP=nab-paclitaxel; TCD=CD4/CD8 depletion). (B) Flow cytometric analysis of subcutaneous PDA tumors treated as indicated (day 18 after tumor injection, day 7 after αCD40 treatment; P=αPD-1; C=αCTLA-4). One way ANOVA %CD8s of live cells: p=0.17; one-way ANOVA %Tregs of CD4+ T cells: p=0.0004; one-way ANOVA CD8:Treg Ratio: p=0.0005. Post hoc test p values indicated where statistically significant as *p≤ 0.05, **p≤ 0.01, ***p≤ 0.001. (C) Experimental design for 1st tumor rechallenge experiments. Table quantifies fraction and percentage of mice that rejected tumor rechallenge in mice that had rejected the initial tumor implantation and were tumor-free for at least 43 days. Data compiled from 3 independent experiments. (D) Experimental design for 2nd tumor rechallenge experiment. The 2nd rechallenge occurred on day 31-49 after the first rechallenge. Table quantifies fraction and percentage of mice that rejected the 2nd tumor rechallenge in mice that had rejected a 1st tumor rechallenge. Host mice in this experiment were either treated with αCD8 (n=11) or isotype (Iso; n=6) antibodies. Survival analysis of mice after the 2nd rechallenge with or without CD8 depletion is shown. Data compiled from 2 independent experiments.
Figure 5
Figure 5. Combination of αCD40/chemotherapy and PD-1 blockade improves survival in KPC genetic model of PDA
(A) Experimental design for randomized, controlled study in tumor-bearing KPC mice, treated with αCD40/chemotherapy and αPD-1, as described in Materials and Methods. G=gemcitabine; nP=nab-paclitaxel; q3d= antibody administered every 3 days. (B) Overall survival analysis of tumor-bearing KPC mice treated as indicated (n=6-8 per cohort). αPD-1 alone vs. isotype alone p=0.39; CD40/G/nP vs. isotype alone p=0.76; CD40/G/nP + αPD-1 vs. isotype alone p=0.015. (C) Median overall survival of tumor-bearing KPC mice as indicated.

References

    1. Rahib L, Smith BD, Aizenberg R, Rosenzweig AB, Fleshman JM, Matrisian LM. Projecting cancer incidence and deaths to 2030: the unexpected burden of thyroid, liver, and pancreas cancers in the United States. Cancer Res. 2014;74:2913–21. - PubMed
    1. Conroy T, Desseigne F, Ychou M, Bouché O, Guimbaud R, Bécouarn Y, et al. FOLFIRINOX versus gemcitabine for metastatic pancreatic cancer. N Engl J Med. 2011;364:1817–25. - PubMed
    1. Hoff von DD, Ervin T, Arena FP, Chiorean EG, Infante J, Moore M, et al. Increased survival in pancreatic cancer with nab-paclitaxel plus gemcitabine. N Engl J Med. 2013;369:1691–703. - PMC - PubMed
    1. Schreiber RD, Old LJ, Smyth MJ. Cancer immunoediting: integrating immunity's roles in cancer suppression and promotion. Science. 2011;331:1565–70. - PubMed
    1. Odorizzi PM, Wherry EJ. Inhibitory receptors on lymphocytes: insights from infections. J Immunol. 2012;188:2957–65. - PMC - PubMed

Publication types

MeSH terms