. 2015 Feb 13;11(2):e1003983.
doi: 10.1371/journal.pcbi.1003983. eCollection 2015 Feb.

Integrative multi-omics module network inference with Lemon-Tree

Affiliations

Integrative multi-omics module network inference with Lemon-Tree

Eric Bonnet et al. PLoS Comput Biol. .

Abstract

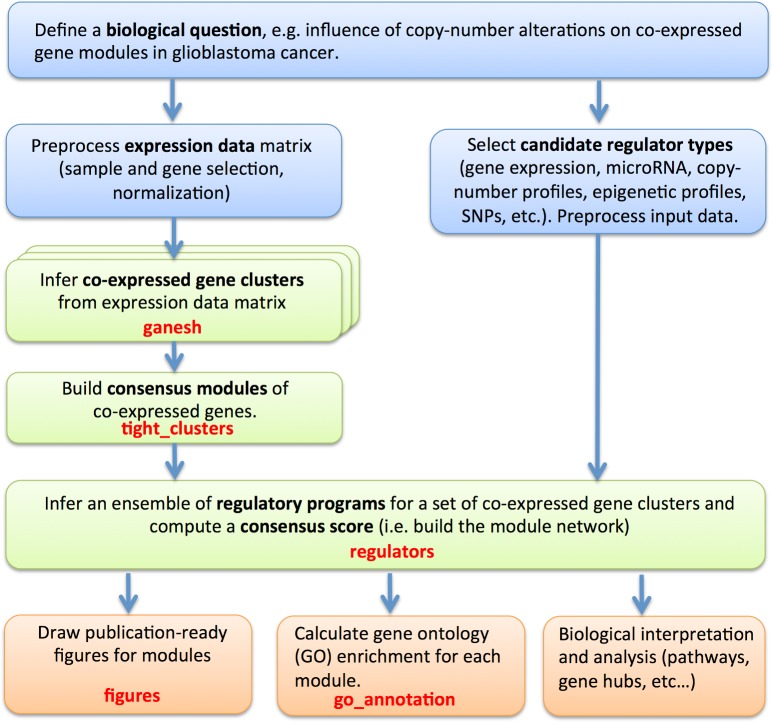
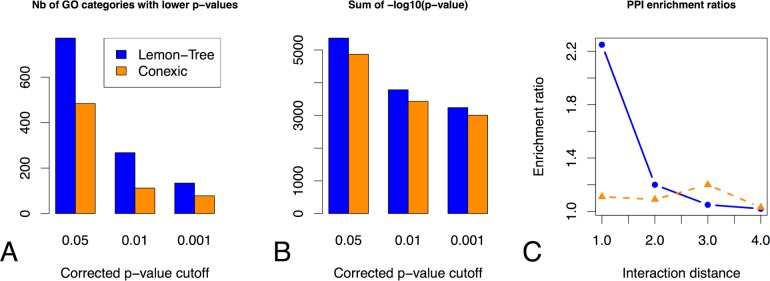
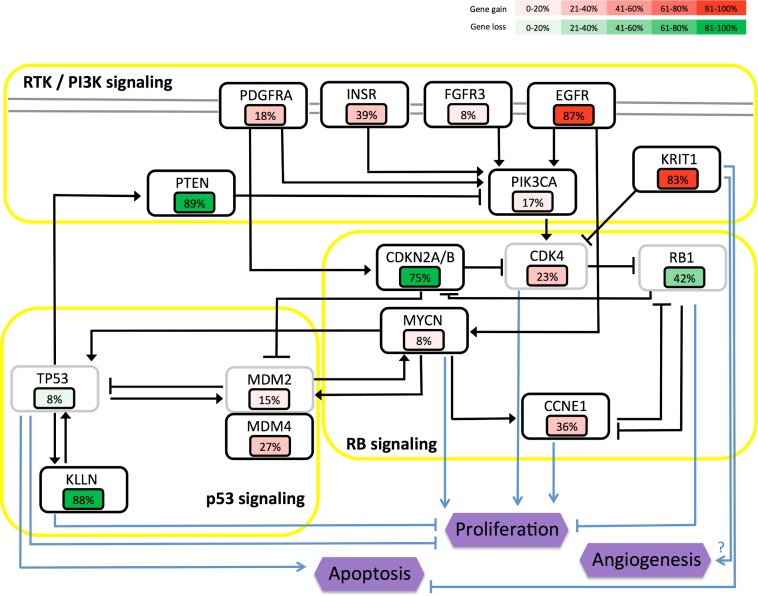
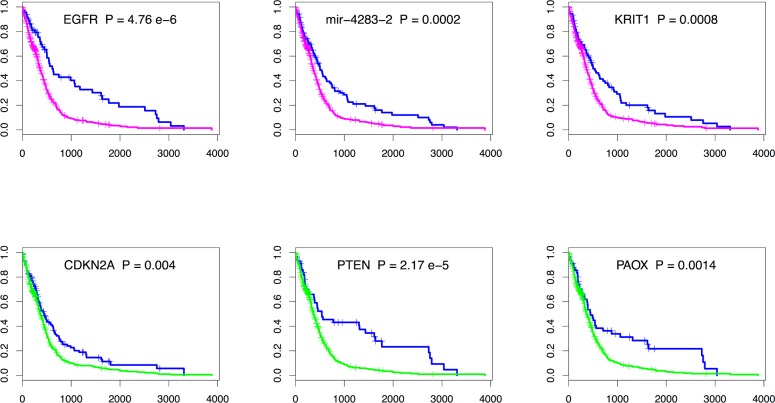
Module network inference is an established statistical method to reconstruct co-expression modules and their upstream regulatory programs from integrated multi-omics datasets measuring the activity levels of various cellular components across different individuals, experimental conditions or time points of a dynamic process. We have developed Lemon-Tree, an open-source, platform-independent, modular, extensible software package implementing state-of-the-art ensemble methods for module network inference. We benchmarked Lemon-Tree using large-scale tumor datasets and showed that Lemon-Tree algorithms compare favorably with state-of-the-art module network inference software. We also analyzed a large dataset of somatic copy-number alterations and gene expression levels measured in glioblastoma samples from The Cancer Genome Atlas and found that Lemon-Tree correctly identifies known glioblastoma oncogenes and tumor suppressors as master regulators in the inferred module network. Novel candidate driver genes predicted by Lemon-Tree were validated using tumor pathway and survival analyses. Lemon-Tree is available from http://lemon-tree.googlecode.com under the GNU General Public License version 2.0.


Conflict of interest statement

The authors have declared that no competing interests exist.

Figures

Fig 1
Fig 1. Flow chart for integrative module network inference with Lemon-Tree.
This figure shows the general workflow for a typical integrative module network inference with Lemon-Tree. Blue boxes indicate the pre-processing steps that are done using third-party software such as R or user-defined scripts. Green boxes indicate the core module network inference steps done with the Lemon-Tree software package. Typical post-processing tasks (orange boxes), such as GO enrichment calculations, can be performed with Lemon-Tree or other tools. The Lemon-Tree task names are indicated in red (see main text for more details).
Fig 2
Fig 2. Comparison between Lemon-Tree and CONEXIC.
Gene Ontology (GO) enrichment of the co-expressed gene clusters, indicated by counting the number of GO categories having a lower p-value (A) and by comparing the sum of the quantity -log10(p-value) (B) for different global p-value cutoff levels (x-axis). (C) Relative enrichment of inferred interactions by Lemon-Tree and CONEXIC to known molecular protein-protein interactions (PPI), for increasing interaction distances.
Fig 3
Fig 3. Glioblastoma signaling pathway alterations for top hub regulators.
Copy number alterations for a selection of predicted hub regulators are indicated for canonical glioblastoma signaling pathways p53, RB and RTK/PI3K. Genes selected by the algorithm are indicated in black boxes, while light grey boxes depict genes that were not selected by the algorithm but are key factors for the pathway. Purple hexagons indicate phenotypes. Percentage of copy gain or loss is indicated by value and by color shades of red for gene gains and green for gene losses. The values are taken from GISTIC putative calls for low-levels gains or single-copy losses on 563 glioblastoma samples (data from the Broad institute).
Fig 4
Fig 4. Kaplan-Meier survival curves for a selection of top hub glioblastoma genes predicted by the Lemon-Tree algorithm.
The top three panels are genes having low-levels gains or high-level amplifications (magenta) compared to normal (blue), the bottom three panels are genes having single-copy loss or homozygous deletions (green) compared to normal (blue). All genes display significant differences between the groups (p < 0.05, see S6 Table for a full list of p-values). Patient with putative gene gains or losses have significantly worse prognosis (lower values on the y-axis). The x-axis on all figures represent the time in number of days.

References

    1. Hawkins RD, Hon GC, Ren B (2010) Next-generation genomics: an integrative approach. Nature Reviews Genetics 11: 476–486. 10.1038/nrg2795 - DOI - PMC - PubMed
    1. Garraway LA, Widlund HR, Rubin MA, Getz G, Berger AJ, et al. (2005) Integrative genomic analyses identify mitf as a lineage survival oncogene amplified in malignant melanoma. Nature 436: 117–122. - PubMed
    1. McLendon R, Friedman A, Bigner D, Van Meir EG, Brat DJ, et al. (2008) Comprehensive genomic characterization defines human glioblastoma genes and core pathways. Nature 455: 1061–1068. 10.1038/nature07385 - DOI - PMC - PubMed
    1. Hudson TJ, Anderson W, Aretz A, Barker AD, Bell C, et al. (2010) International network of cancer genome projects. Nature 464: 993–998. 10.1038/nature08987 - DOI - PMC - PubMed
    1. Segal E, Shapira M, Regev A, Pe’er D, Botstein D, et al. (2003) Module networks: identifying regulatory modules and their condition-specific regulators from gene expression data. Nat Genet 34: 166–167. - PubMed

Publication types

LinkOut - more resources