. 2015 Feb 13;10(2):e0116508.
doi: 10.1371/journal.pone.0116508. eCollection 2015.

Large scale aggregate microarray analysis reveals three distinct molecular subclasses of human preeclampsia

Affiliations

Large scale aggregate microarray analysis reveals three distinct molecular subclasses of human preeclampsia

Katherine Leavey et al. PLoS One. .

Abstract

Background: Preeclampsia (PE) is a life-threatening hypertensive pathology of pregnancy affecting 3-5% of all pregnancies. To date, PE has no cure, early detection markers, or effective treatments short of the removal of what is thought to be the causative organ, the placenta, which may necessitate a preterm delivery. Additionally, numerous small placental microarray studies attempting to identify "PE-specific" genes have yielded inconsistent results. We therefore hypothesize that preeclampsia is a multifactorial disease encompassing several pathology subclasses, and that large cohort placental gene expression analysis will reveal these groups.

Results: To address our hypothesis, we utilized known bioinformatic methods to aggregate 7 microarray data sets across multiple platforms in order to generate a large data set of 173 patient samples, including 77 with preeclampsia. Unsupervised clustering of these patient samples revealed three distinct molecular subclasses of PE. This included a "canonical" PE subclass demonstrating elevated expression of known PE markers and genes associated with poor oxygenation and increased secretion, as well as two other subclasses potentially representing a poor maternal response to pregnancy and an immunological presentation of preeclampsia.

Conclusion: Our analysis sheds new light on the heterogeneity of PE patients, and offers up additional avenues for future investigation. Hopefully, our subclassification of preeclampsia based on molecular diversity will finally lead to the development of robust diagnostics and patient-based treatments for this disorder.


Conflict of interest statement

Competing Interests: The authors have declared that no competing interests exist.

Figures

Fig 1
Fig 1. Unsupervised multivariate model-based clustering of the aggregate data set of 77 preeclamptics and 96 controls.
(A) The Mclust model VEI (diagonal, equal shape) gave the best performance based on the Bayesian Information Criterion (BIC; y-axis) and an optimal cluster number of 3 was selected (clusters; x-axis). (B) Cluster 2 was composed entirely of PE samples while the remaining two clusters consisted of a mixture of preeclamptic and control samples. (C) Principal component analysis (PCA) was performed on the data to allow for cluster visualization in component space. Under PCA, samples closer together demonstrate higher similarity in gene expression. PC1–3 are principal components 1–3, respectively, while colours indicate cluster membership (1, Blue; 2, Red; 3, Green), with light shades denoting controls and dark shades indicating preeclamptics.
Fig 2
Fig 2. Potential confounding factors of clustering.
(A) No differential segregation of late-onset PE samples was observed compared to the remaining early-onset preeclamptics. Molecular cluster members are identified by color-coded circles (cluster 1—blue, cluster 2—red, cluster 3—green). (B) The few identified preterm controls (<34 weeks) were found in cluster 3 (circled in green). The youngest identified PE samples (<30 weeks) were in cluster 2 (circled in red) while the oldest PE samples (>37 weeks) belonged to cluster 1 (circled in blue). (C) Principal variance component analysis (PVCA) on the full data set of preeclamptics and controls was performed to quantify the effect of each factor (and pairwise interactions between factors) on the gene expression variability within the data set. Minimal contributions were observed from the covariates and most pairwise interactions. Importantly, however, cluster membership was found to be responsible for more than twice the transcriptional variation than the clinical diagnosis (12.4% versus 4.9%), indicating a diversity of molecular groups with common clinical presentation. The residual variability observed (59%) was likely due to additional covariates that could not be accounted for as well as underlying non-pathological heterogeneity amongst the human samples. Although this value is still high, it is significantly reduced compared to a previously published PVCA interrogation of placental gene expression (residual: 86%) [6], employing a binary clinical classification.
Fig 3
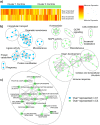
Fig 3. Investigation into the splitting of the control samples.
(A) The possible existence of a sampling bias was explored using a heatmap of the mean expression of 35 known endothelial-enriched genes and the mean expression of 20 known trophoblast-enriched genes. Samples with high gene expression are coloured red, with a gradient of decreasing expression down to white. We observed a general up-regulation of trophoblast marker expression (top panel) in cluster 1 controls (blue), and an increased expression of endothelial genes (bottom panel) in controls belonging to cluster 3 (green), implying that a mild sampling bias may be involved in the formation of the two control subclasses. A heatmap with the expression pattern of each individual gene can be found in S2 Fig. (B) The controls in clusters 1 and 3 were compared by gene-set enrichment analysis (GSEA). Results were visualized in Cytoscape and networks of related ontologies (shown as coloured nodes connected by grey edges, representing common genes between gene sets) were circled and assigned a group label. Ontologies labeled as “miscellaneous” did not share genes with any of the networks. Cluster 1 controls (C1) revealed a significant over-representation of genes generally involved in pregnancy and normal pregnancy processes (blue), while cluster 3 controls (C3) demonstrated an increase in genes related to organ development and extracellular matrix structure (green), as well as an abundance of terms associated with immune response. (C) Enlargement of the immune response network enriched to cluster 3 controls with individual gene sets labelled. Therefore, the controls are most likely splitting because the placentas found in cluster 1 were involved in fairly “normal” pregnancies, while those belonging to cluster 3 experienced a strong immunological response during gestation, significantly affecting their gene expression.
Fig 4
Fig 4. Biomarkers of preeclampsia.
(A) Only the samples in the PE-enriched cluster 2 (circled in red) demonstrated increased expression of the two most frequently studied markers of PE, sFLT1 and sENG (pink), while the remaining preeclamptics in clusters 1 (circled in blue) and 3 (circled in green) displayed low levels of both of these markers (green), in line with control values of expression. (B) Density plots of the mean expression of the top 10 genes significantly elevated in the preeclamptics compared to the controls (LEP, HTRA4, FSTL3, LHB, TREM1, ENG, PAPPA2, FLT1, INHBA, and INHA). Considerable overlap in expression was observed between the controls (dashed pink) and the preeclamptics as a cohesive group (dashed purple). However, when the preeclamptic placentas were split into their three subclasses, cluster 2 PE samples (PE2; solid red) were easily separated from the controls, while the preeclamptics in clusters 1 (PE1; solid blue) and 3 (PE3; solid green) still demonstrated considerable overlap. (C) Naive Bayes classification using these 10 PE markers was able to distinguish >95% of the PE samples in cluster 2 (PE2; red) from the controls at a 5% false positive rate (dashed black line), while only ~50% and ~40% of the preeclamptics in clusters 1 (PE1; blue) and 3 (PE3; green), respectively, could be correctly categorized. This led to an overall ability of these markers to correctly identify approximately 70% of all the PE samples as preeclamptic (purple), as has been published. This analysis indicates that poor biomarker performance is likely due to molecular heterogeneity resulting from different etiological origins of preeclampsia.
Fig 5
Fig 5. Gene set enrichment analysis (GSEA) results for the comparison of PE subclasses.
GSEA outputs were visualized in Cytoscape and networks of related ontologies (shown as colored nodes connected by grey edges, representing common genes between gene sets) were circled and assigned a group label. Ontologies labeled as “miscellaneous” did not share genes with any of the networks. (A) In contrast to the remaining PE subclasses, the preeclamptics in cluster 1 (PE1) were found to be enriched in very few gene sets (blue), most of which were related to organelle membranes and envelopes; the preeclamptics in cluster 2 (PE2) displayed up-regulation of genes associated with feeding behaviour, B-cell activation, and hormone secretion (red); and the PE samples in cluster 3 (PE3) demonstrated an over-representation (green) of genes involved in organ development and extracellular matrix structure, as well as numerous terms associated with immune response. (B) Enlargement of the immune response network, including the response to virus ontology, enriched to cluster 3 PE samples with individual gene sets labelled. Overall, cluster 1 PE samples do not appear to demonstrate an overt PE pathology; the enrichments observed in cluster 2 PE samples fit with our canonical understanding of preeclampsia; and the PE samples in cluster 3 exhibit a potential pathogenic etiology of preeclampsia.

Similar articles

Cited by

References

    1. Vigil-De Gracia P (2009) Maternal deaths due to eclampsia and HELLP syndrome. Int J Gynaecol Obstet 104: 90–94. 10.1016/j.ijgo.2008.09.014 - DOI - PubMed
    1. Wallis AB, Saftlas AF, Hsia J, Atrash HK (2008) Secular trends in the rates of preeclampsia, eclampsia, and gestational hypertension, United States, 1987–2004. Am J Hypertens 21: 521–526. 10.1038/ajh.2008.20 - DOI - PubMed
    1. Levine RJ, Maynard SE, Qian C, Lim K-H, England LJ, et al. (2004) Circulating angiogenic factors and the risk of preeclampsia. N Engl J Med 350: 672–683. 10.1056/NEJMoa031884 - DOI - PubMed
    1. Kleinrouweler CE, Wiegerinck MMJ, Ris-Stalpers C, Bossuyt PMM, van der Post J a M, et al. (2012) Accuracy of circulating placental growth factor, vascular endothelial growth factor, soluble fms-like tyrosine kinase 1 and soluble endoglin in the prediction of pre-eclampsia: a systematic review and meta-analysis. BJOG 119: 778–787. 10.1111/j.1471-0528.2012.03311.x - DOI - PubMed
    1. Cnossen J, Morris R, ter Riet G, Mol B, van der Post J, et al. (2008) Use of uterine artery Doppler ultrasonography to predict pre-eclampsia and intrauterine growth restriction: a systematic review and bivariable meta-analysis. CMAJ 178: 1–11. - PMC - PubMed

Publication types