

Validated predictive modelling of the environmental resistome
- PMID: 25679532
- PMCID: PMC4438333
- DOI: 10.1038/ismej.2014.237
Validated predictive modelling of the environmental resistome
Abstract
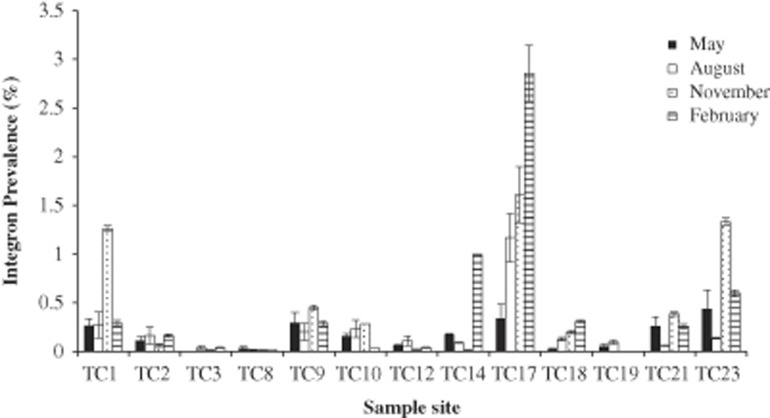
Multi-drug-resistant bacteria pose a significant threat to public health. The role of the environment in the overall rise in antibiotic-resistant infections and risk to humans is largely unknown. This study aimed to evaluate drivers of antibiotic-resistance levels across the River Thames catchment, model key biotic, spatial and chemical variables and produce predictive models for future risk assessment. Sediment samples from 13 sites across the River Thames basin were taken at four time points across 2011 and 2012. Samples were analysed for class 1 integron prevalence and enumeration of third-generation cephalosporin-resistant bacteria. Class 1 integron prevalence was validated as a molecular marker of antibiotic resistance; levels of resistance showed significant geospatial and temporal variation. The main explanatory variables of resistance levels at each sample site were the number, proximity, size and type of surrounding wastewater-treatment plants. Model 1 revealed treatment plants accounted for 49.5% of the variance in resistance levels. Other contributing factors were extent of different surrounding land cover types (for example, Neutral Grassland), temporal patterns and prior rainfall; when modelling all variables the resulting model (Model 2) could explain 82.9% of variations in resistance levels in the whole catchment. Chemical analyses correlated with key indicators of treatment plant effluent and a model (Model 3) was generated based on water quality parameters (contaminant and macro- and micro-nutrient levels). Model 2 was beta tested on independent sites and explained over 78% of the variation in integron prevalence showing a significant predictive ability. We believe all models in this study are highly useful tools for informing and prioritising mitigation strategies to reduce the environmental resistome.
Figures


References
-
- Amos GC, Zhang L, Hawkey PM, Gaze WH, Wellington EM. Functional metagenomic analysis reveals rivers are a reservoir for diverse antibiotic resistance genes. Vet Microbiol. 2014;171:441–447. - PubMed
-
- Bowes MJ, Smith JT, Neal C, Leach DV, Scarlett PM, Wickham HD, et al. Changes in water quality of the River Frome (UK) from 1965 to 2009: is phosphorus mitigation finally working. Sci Total Environ. 2011;409:3418–3430. - PubMed
-
- Bowes MJ, Gozzard E, Johnson AC, Scarlett PM, Roberts C, Read DS, et al. Spatial and temporal changes in chlorophyll-a concentrations in the River Thames basin, UK: are phosphorus concentrations beginning to limit phytoplankton biomass. Sci Total Environ. 2012;426:45–55. - PubMed
Publication types
MeSH terms
Substances
LinkOut - more resources
Full Text Sources
Other Literature Sources
Medical
