. 2015 Feb 12;160(4):771-784.
doi: 10.1016/j.cell.2015.01.026.

Targeting the adaptability of heterogeneous aneuploids

Affiliations

Targeting the adaptability of heterogeneous aneuploids

Guangbo Chen et al. Cell. .

Abstract

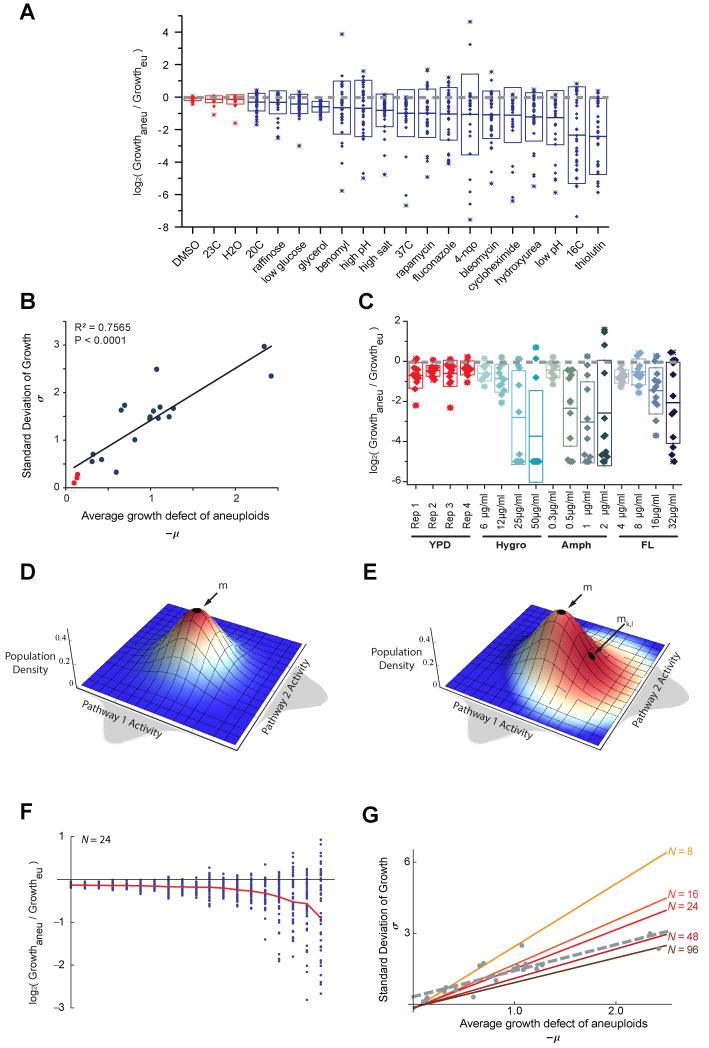
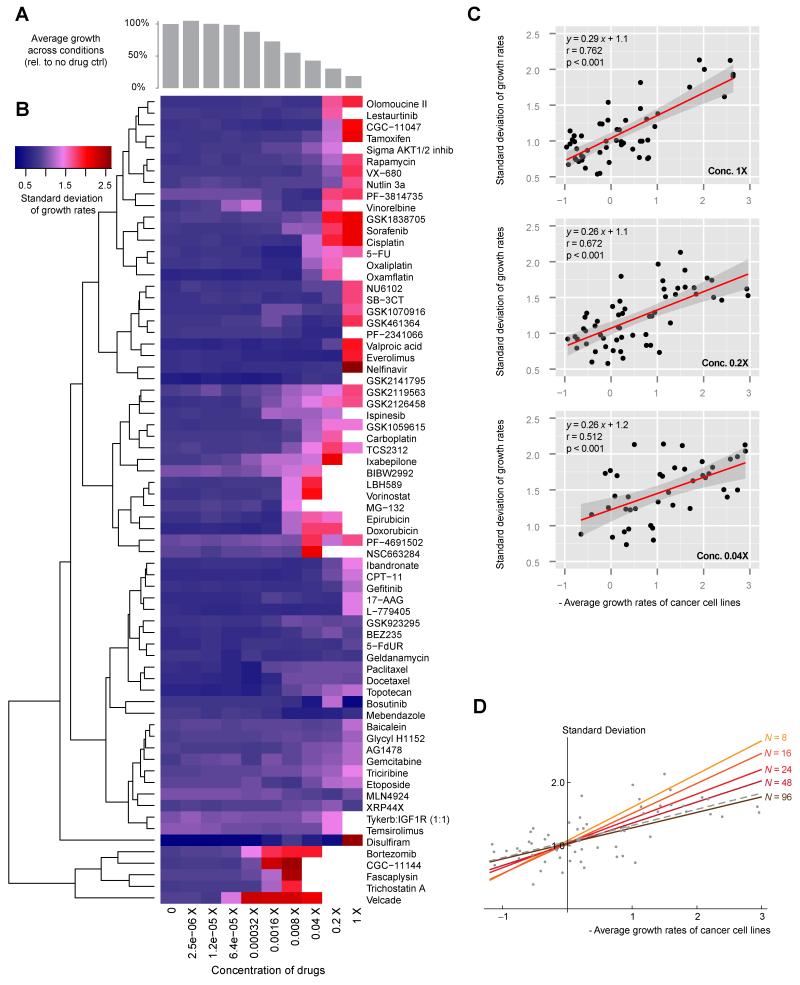
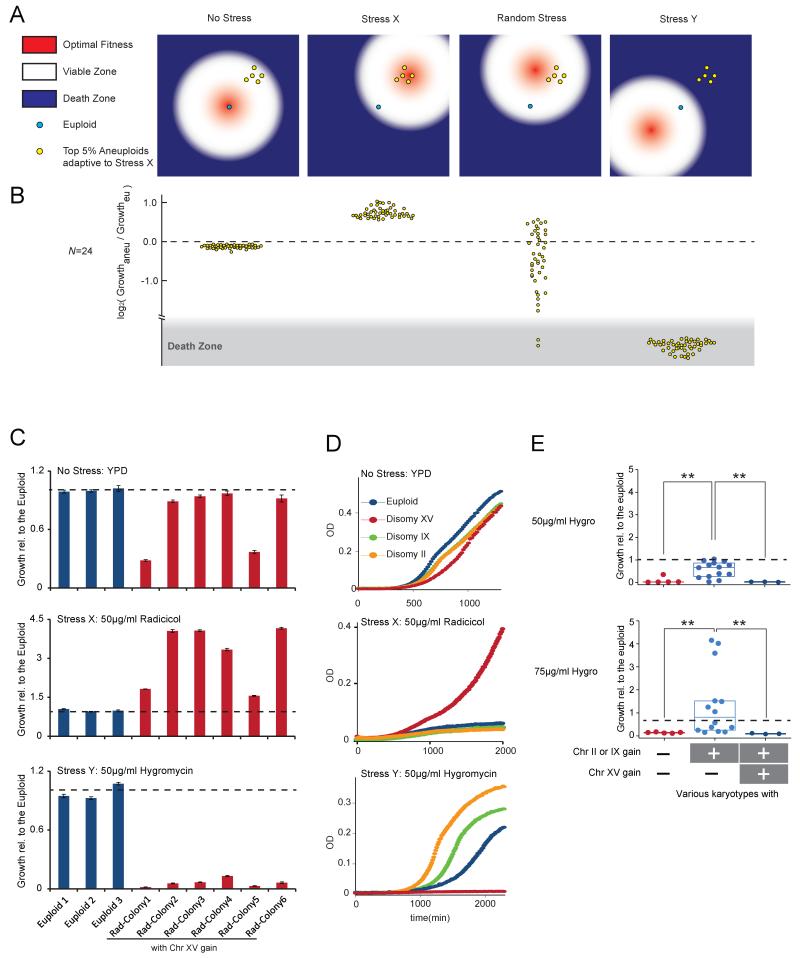
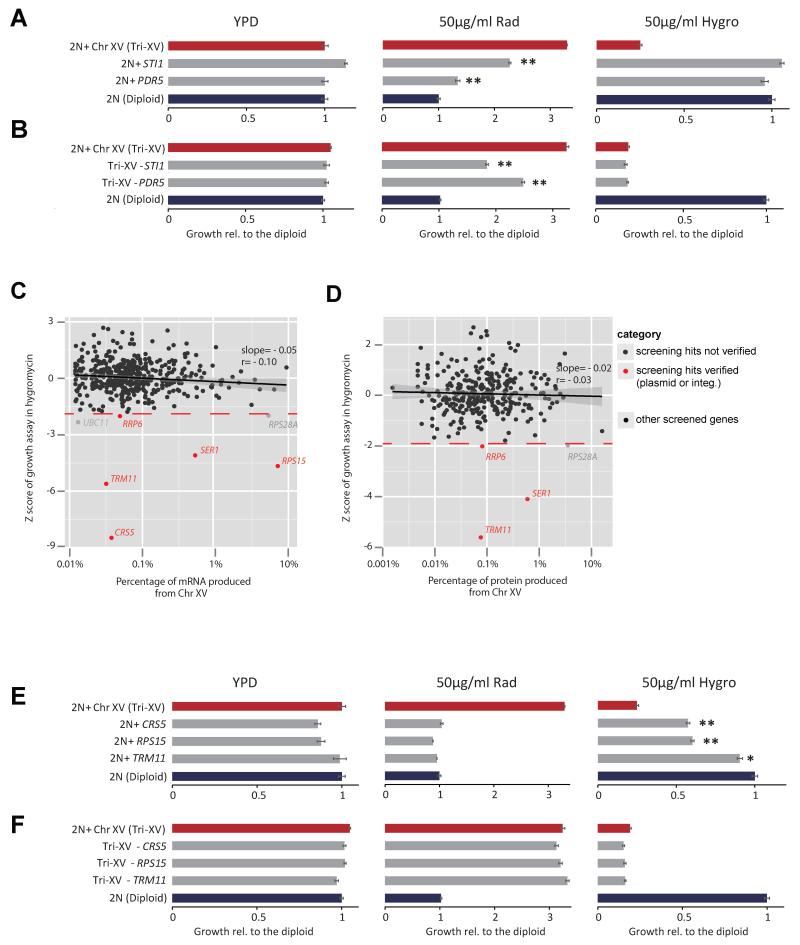
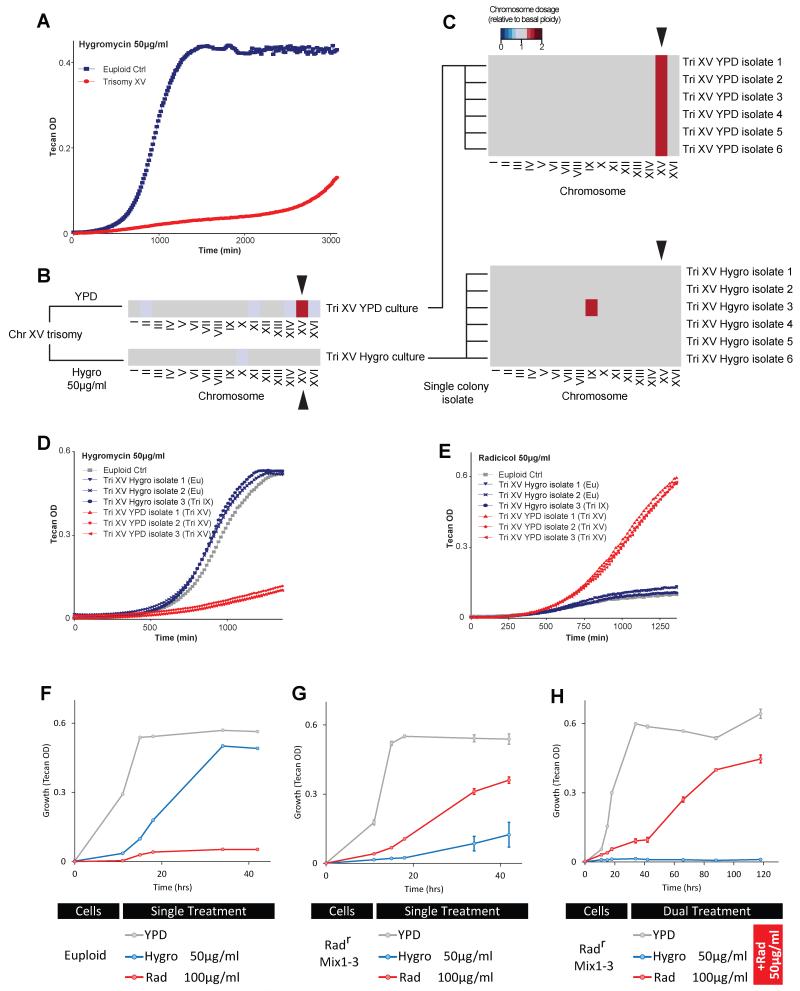
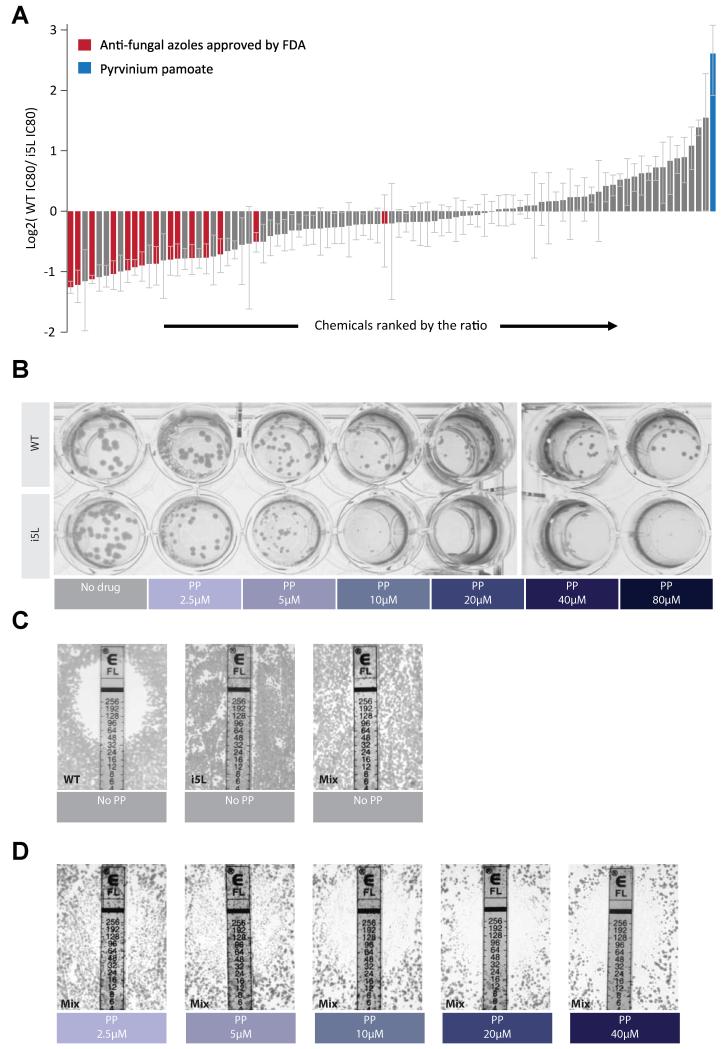
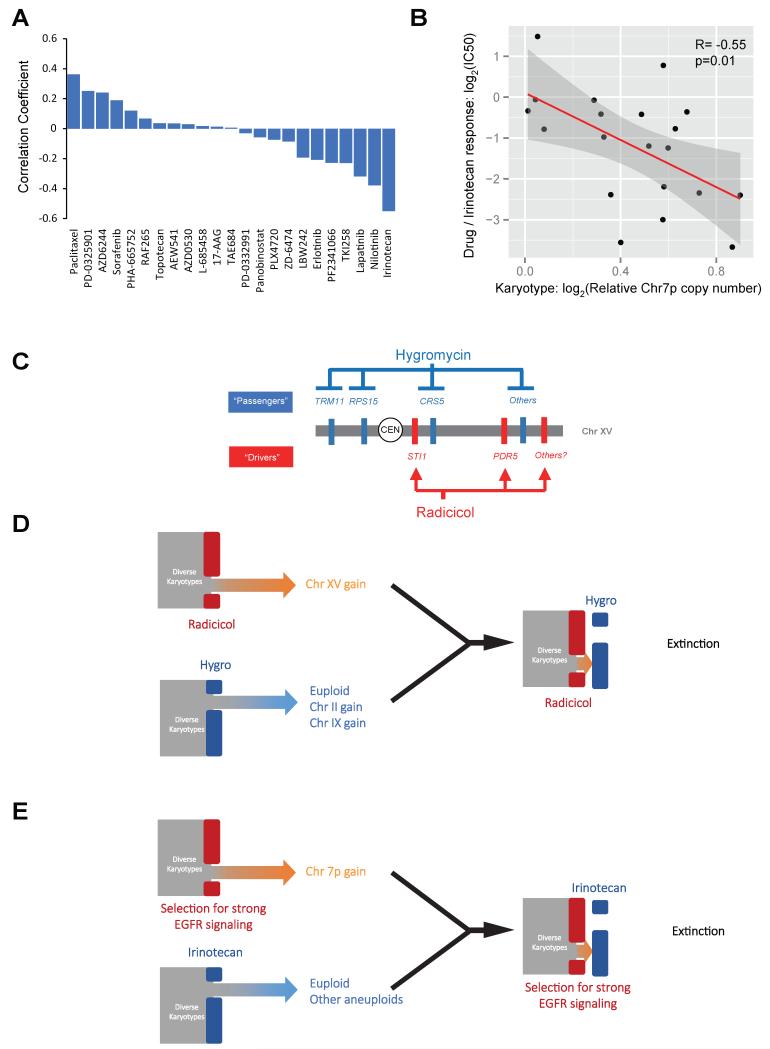
Aneuploid genomes, characterized by unbalanced chromosome stoichiometry (karyotype), are associated with cancer malignancy and drug resistance of pathogenic fungi. The phenotypic diversity resulting from karyotypic diversity endows the cell population with superior adaptability. We show here, using a combination of experimental data and a general stochastic model, that the degree of phenotypic variation, thus evolvability, escalates with the degree of overall growth suppression. Such scaling likely explains the challenge of treating aneuploidy diseases with a single stress-inducing agent. Instead, we propose the design of an "evolutionary trap" (ET) targeting both karyotypic diversity and fitness. This strategy entails a selective condition "channeling" a karyotypically divergent population into one with a predominant and predictably drugable karyotypic feature. We provide a proof-of-principle case in budding yeast and demonstrate the potential efficacy of this strategy toward aneuploidy-based azole resistance in Candida albicans. By analyzing existing pharmacogenomics data, we propose the potential design of an ET against glioblastoma.


Figures

Figure 1
Figure 1. Scaling of phenotypic variation with growth suppression in aneuploids under diverse stress conditions
(A) The growth of 38 aneuploid strains relative to the euploid, as log2ratio of aneuploid growth (OD increase) over the euploid with the nearest ploidy (see Supplemental Information), are binned by growth conditions. Each point in a box plot represents an aneuploidy strain. The half-length of each box represents the standard deviation (SD) of relative growth among aneuploids (σ) and the middle line represents the average (μ). Note that the horizontal dashed line across 0 represents the euploid control. (B) Phenotypic variation among the aneuploids, measured as SD of relative growth (σ), scales with average growth defect of the aneuploid cohort across diverse stress conditions (−μ). (C) The growth of 12 disomy strains relative to the haploid control under increasing concentrations of hygromycin B (Hygro), amphotericin B (Amph) or fluconazole (FL). Box plot representation is as described for (a). (D-E) Schematic representation of the model is shown for the simple case of N = 2 with axes as labeled. Deep blue to deep red code for increasing fitness. (D) Graph represents the stress-free condition, where the euploid is located at the center of the activity field (position m) assumes highest fitness. (E) Graph represents a stress condition, where the optimal fitness point shifts from m to mk,l, reflecting the activity change necessary for adaptation. Consequently, the euploid (located at point m) no longer holds maximal fitness, whereas higher fitness is assumed by certain aneuploids (those occupying redder regions). (F) Example simulation results of the model for 50 random aneuploids under diverse stress conditions (governed by varying type k and magnitude l) for a 24 dimension space (N = 24), with relative growth displayed as the experimental data in A. The red line shows average log2 growth ratio from the simulated aneuploid population. Note the appearance of adaptive aneuploids under high-stress conditions (toward the right of the graph). (G) Simulations of the model with a wide range of N values demonstrate the positive correlation between σ and -μ in various numbers of dimensions. The simulated correlations are shown in colored lines while the experimental data is overlaid in grey. See also Figure S1.
Figure 2
Figure 2. Phenotypic heterogeneity of human cancer cell lines positively correlates with increasing growth suppression by therapeutic compounds
The relationship between phenotypic variation (SD of growth rates) and average growth suppression was examined using published drug response profiling data from 54 breast cancer cell lines treated with 77 different potential therapeutic compounds over 10 different concentrations (see Supplementary Information). (A) Histograms showing average growth suppression under different drug concentrations. (B) The SD of growth rates caused by each drug under the range of concentrations tested are shown as a heat map. Note that drug concentrations for A and B are aligned, showing the general trend of increasing SD with increasing growth suppression. The clustering is based on Euclidean distances. (C) At 3 concentrations that considerably reduced the overall growth rate (> 50% decrease compared to no drug control in A), the general correlation between μ and σ across different growth conditions is examined. The linear regression line (red) is surrounded by 95 percentile confidence fitting intervals (dark gray area). Note similar fitting parameters across different drug doses. (D) The correlation between SD and average growth suppression is also recapitulated by simulations of the multi-dimensional model with the number of pathways (N) in the range of 48-96. The modeled fitting is shown in colored lines, while the published experimental data are shown in gray. See also Figure S2.
Figure 3
Figure 3. Design and experimental implementation of ET in budding yeast
(A-B) Model simulations predict cell population adapted to a specific stress (X) through karyotype channeling can be highly targetable by a stress Y that shifts optimal fitness in the direction opposite to X, but not by a second stress in a random direction. (A) Schematic representations of the fitness landscape in a simplified 2D example similar to that in Figure 1D, E but projected to the plane defined by pathway activities. (B) Results of model simulations in a high dimensional fitness space under conditions indicated in A. Note that only the aneuploids selected by Stress X (the top 5% adaptive ones) are shown. A total of 1000 cells were simulated. Each dot represents the relative fitness of an aneuploid cell compared to the euploid. Death zone was defined as having negative growth value. (C) Six independent colonies isolated from radicicol-adapted population aneuploids with gain of Chr XV (as shown in Figure S3F) were grown under indicated conditions until saturation was reached in the fastest growing strain. Histograms show average amount of growth normalized to euploid and standard error of the mean (SEM) derived from 4 replicates. (D) Chr II and Chr IX disomy strains generated previously by genetic manipulation (Torres et al., 2007) exhibit resistance to hygromycin B yet are sensitive to radicicol. (E) Aneuploid strains generated by random triploid meiotic segregation with indicated karyotypic features were culture in different concentrations of hygromycin B. Box plots show growth relative to the euploid control with each dot representing an aneuploid strain. Karyotypes are categorized by their states of Chr II/IX/XV dosage, but other chromosome aneuploidy may also be present in these strains. The amount of growth (OD increase) was normalized to the euploid with the nearest ploidy. The dashed line represents the average of normalized controls (equals to 1). ** indicates p< 0.01 according to Mann-Whitney U test. See also Figure S3 and 4.
Figure 4
Figure 4. Different sets of genes on Chr XV cause radicicol sensitivity or hygromycin B sensitivity when increased in copy number
(A-B) Copy number gain (+, by genomic integration) or loss (−, by genomic deletion) assays showing that increased copy numbers of STI1 and PDR5, which are both critical for radicicol resistance, do not contribute to the hygromycin B hypersensitivity. Relative growth compared to the diploid control is reported in bar plots with the SEM derived from 3 replicates. Asterisks denote significant difference from the corresponding control (the diploid or Chr XV trisomy (Tri-XV)) (*, p< 0.05; **, p<0.01; two-tail t-test). (C-D) Each of 453 genes located on Chr XV was transformed into a diploid strain,and Z scores denoting the deviation of growth of each strain from the population average in the presence of 35 μg/ml hygromycin B were plotted against mRNA (C), using RNAseq data, or protein expression abundance (D) (Ghaemmaghami et al., 2003), of each tested gene in the euploid S288c background. Note that protein abundance data were not retrieved for 30% genes (including CRS5 and RPS15). The grey area shows the 95% confidence interval for the linear fitting. 35 μg/ml hygromycin B produced similar growth inhibition to euploid control in SC –ura media compared to euploid control in YPD media. (E) Growth assays showing that copy-number increase (by genomic integration) of 3 genes (CRS5, RPS15, TRM11) on Chr XV were individually sufficient in a diploid euploid context to reproduce enhanced sensitivity to hygromycin B, but not radicicol resistance, contrasting copy number increase for STI1 and PDR5 as shown in A. (F) Growth assays showing that single-copy deletion of none of the 3 genes (CRS5, RPS15, TRM11) alone could rescue Chr XV trisomy from hygromycin B hyper-sensitivity. See also Figure S5.
Figure 5
Figure 5. The combination of radicicol and hygromycin B extincts karyotypically heterogeneous cell population
(A-E) Chr XV trisomy was able to escape growth inhibition by hygromycin B through loss of the gained Chr XV. (A) The growth (represented by OD reading on a Tecan reader) of both the euploid control and the trisomy XV strain was monitored in media containing 50 μg/ml hygromycin B. (B) The additional copy of Chr XV was lost in hygromycin B culture but not in YPD culture, as shown by the heat map of karyotyping result of the final culture. (C) Karyotypes of 6 single colonies from the trisomy XV culture in YPD or hygromycin are shown, three of which were re-tested for growth in the presence of hygromycin B (D) or radicicol (E). Note radicicol sensitivity was re-established in all three adapted colonies from the trisomy XV culture in hygromycin, whereas isolates from the YPD culture remained radicicol resistant. (F-H) Combination of hygromycin B and radicicol effectively eradicates the radicicol-preselected aneuploid population. (F) Growth curves (as OD600 measured in Tecan) of the diploid control strain under conditions as indicated. Note that 50 μg/ml hygromycin B alone had milder growth suppression compared to 100 μg/ml radicicol. (G) Growth curves of 3 populations preselected independently in the presence of radicicol (Figure S3E) under indicated conditions. (H) Growth curves of the same 3 populations as in (b) under indicated conditions where each drug was combined with 50 μg/ml radicicol. Each data point in B and C shows the mean and SEM from 3 experiments. See also Figure S6.
Figure 6
Figure 6. Pyrvinium pamoate (PP) effectively targets the fluconazole-resistant Candida aneuploid
(A) Relative IC80 (80% inhibitory concentration) of the diploid vs the i(5L) Candida strain for each of the hits of the primary drug screen (Figure S7A). (B) Images of agar plates showing selective effectiveness of PP toward i(5L) candida. (C) Resistance of the diploid, the i(5L) or the i(5L)+diploid mix population toward fluconazole. (D) PP at concentrations above 10 μM restored the sensitivity of the i(5L)+diploid mix population toward fluconazole in the e-test, in accordance to its singular form’s activity against the i(5L) strain shown in B. Note even though the initial plating density was the same, due to the inhibition of the i(5L) cells, the overall growth was less in D compared to C. Note that our euploid strain also exhibited a reduced susceptibility to fluconazole compared to the clinical E-test standard strain, which may be attributed to other point mutations (such as the hyperactive TAC1) within this strain (Selmecki et al., 2006). All plate images were taken after 48-hour culture. See also Figure S7.
Figure 7
Figure 7. A potential drug targeting Chr 7 gain in brain cancer and schematic summary of the mechanism and principle of ET using the yeast example
(A) Correlation coefficients of drug response (IC50) with Chr 7p dosage in 29CNS tumor cell lines across 23 different therapeutic compounds were plotted as bar graphs. (B) The dot plot illustrates the details of the correlation between dosage of Chr 7p and sensitivity to irinotecan, with each dot showing the drug response and Chr 7p dosage of each cell line. The red line shows linear fitting and the grey area showing the fitting range with 95% confidence interval. Note that a total of 20 cells lines were included here as the IC50 data for 9 cell lines were not available for irinotecan. (C) The molecular makeup of the ET against aneuploidy yeast. (D) Schematic summary of opposing selective effects of radicicol and hygromycin B on Chr XV gain impose an adaptive dilemma for the yeast heterogeneous aneuploidy population. (E) A ET may be established against glioblastoma by opposing selective effects on Chr 7p gain.

References

    1. Barretina J, Caponigro G, Stransky N, Venkatesan K, Margolin AA, Kim S, Wilson CJ, Lehar J, Kryukov GV, Sonkin D, et al. The Cancer Cell Line Encyclopedia enables predictive modelling of anticancer drug sensitivity. Nature. 2012;483:603–307. - PMC - PubMed
    1. Bean J, Brennan C, Shih J-Y, Riely G, Viale A, Wang L, Chitale D, Motoi N, Szoke J, Broderick S, et al. MET amplification occurs with or without T790M mutations in EGFR mutant lung tumors with acquired resistance to gefitinib or erlotinib. Proceedings of the National Academy of Sciences. 2007;104:20932–20937. - PMC - PubMed
    1. Beroukhim R, Mermel CH, Porter D, Wei G, Raychaudhuri S, Donovan J, Barretina J, Boehm JS, Dobson J, Urashima M, et al. The landscape of somatic copy-number alteration across human cancers. Nature. 2010;463:899–905. - PMC - PubMed
    1. Borneman AR, Desany BA, Riches D, Affourtit JP, Forgan AH, Pretorius IS, Egholm M, Chambers PJ. Whole-Genome Comparison Reveals Novel Genetic Elements That Characterize the Genome of Industrial Strains of <italic>Saccharomyces cerevisiae</italic>. PLoS Genet. 2011;7:e1001287. - PMC - PubMed
    1. Borovinskaya MA, Shoji S, Fredrick K, Cate JHD. Structural basis for hygromycin B inhibition of protein biosynthesis. RNA. 2008;14:1590–1599. - PMC - PubMed

Publication types

MeSH terms

LinkOut - more resources