. 2015 Feb 13;10(2):e0116313.
doi: 10.1371/journal.pone.0116313. eCollection 2015.

Interocular retinal nerve fiber layer thickness difference in normal adults

Affiliations

Interocular retinal nerve fiber layer thickness difference in normal adults

Seung Woo Hong et al. PLoS One. .

Abstract

Purpose: To determine the interocular retinal nerve fiber layer (RNFL) thickness difference of normal subjects.

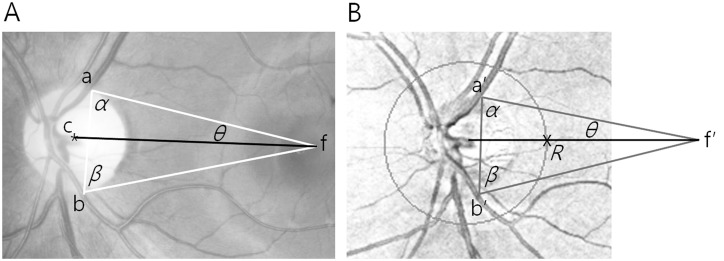
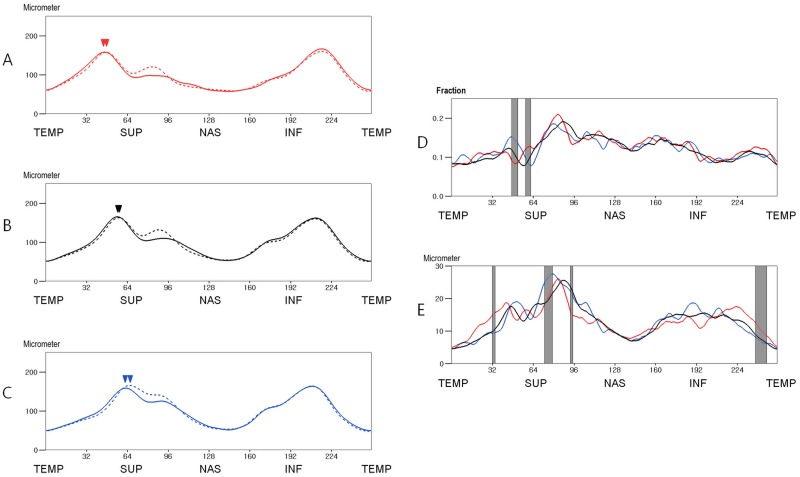
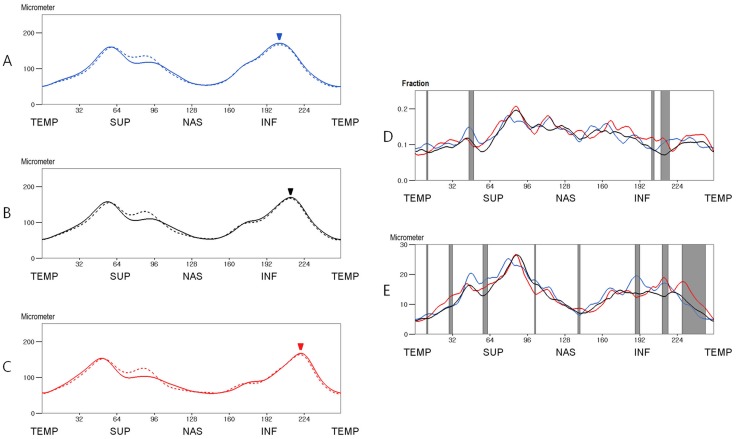
Methods: Both eyes of 230 normal adults received peripapillary RNFL thickness measurements using OCT. The effect of ocular cyclotorsion on the RNFL thickness profile was mathematically corrected. The fractional and absolute interocular RNFL thickness differences at 256 points of peripapillary area were calculated. We divided the subjects into 3 groups according to the locations of superior and inferior peak thickness, respectively, and compared the interocular RNFL thickness differences between the subgroups.

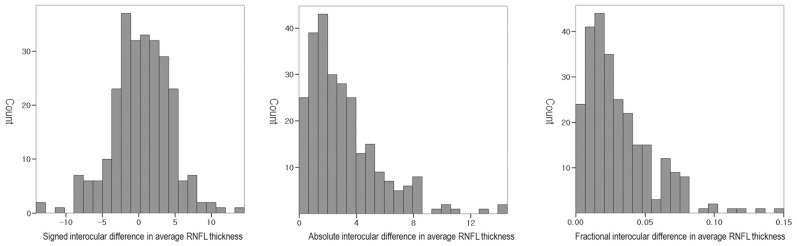
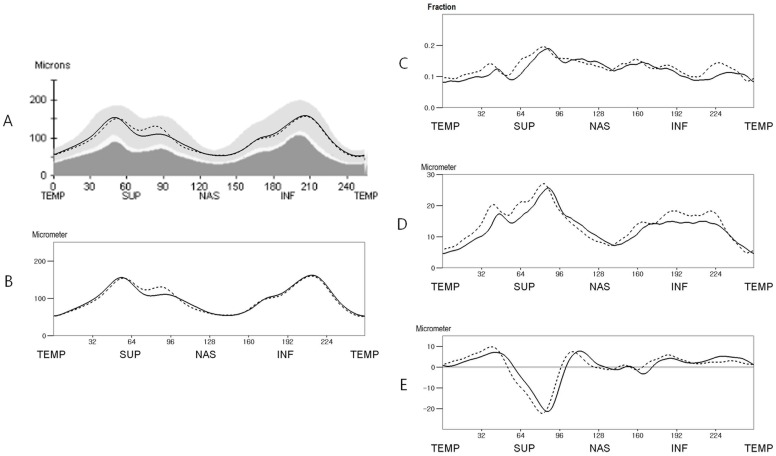
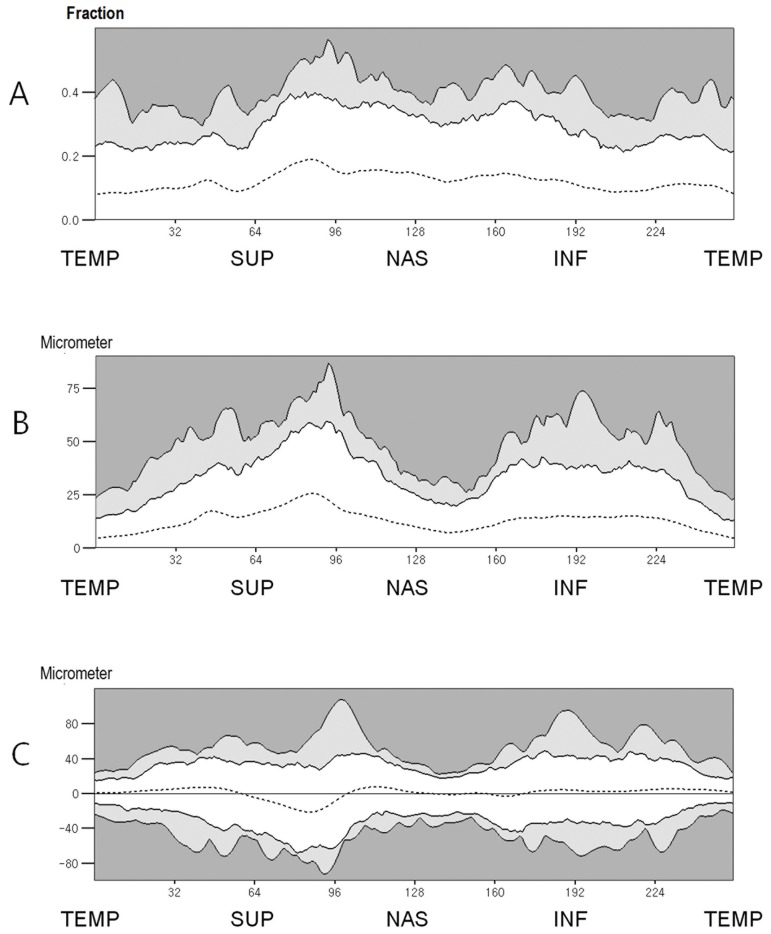
Results: The fractional interocular RNFL thickness difference exhibited smaller regional variations than the absolute interocular difference. The means of fractional interocular differences were 0.100 ± 0.077 in the temporal half area and 0.146 ± 0.105 in the nasal half area, and the tolerance limits for the 95th and 99 th distributions were about 0.246 and 0.344 in the temporal half area and 0.293 and 0.408 in the nasal half area, respectively. The fractional interocular differences of subgroups classified by the locations of superior and inferior peak RNFL thickness showed difference at smaller areas than the absolute interocular differences (19 and 8 points versus 49 and 23 points, respectively).

Conclusion: Glaucoma can be strongly suspected, if interocular fractional RNFL thickness difference is over 25% at 5 consecutive points or over 35% at 3 consecutive points in the temporal half area. The fractional interocular comparison is a better diagnostic approach because the fractional interocular RNFL thickness difference is less influenced by the locations of peak RNFL thickness.


Conflict of interest statement

Competing Interests: The authors have declared that no competing interests exist.

Figures

Fig 1
Fig 1. Fundus photograph and retinal nerve fiber layer (RNFL) thickness deviation map showing the new reference lines.
The new reference line (black line) on the fundus photograph (A) connects the geographic center of the optic nerve head (point c) and the fovea (point f). The white triangle has corners at the fovea (point f) and the points where the temporal borders of the superior temporal retinal vein (point a) and the inferior temporal retinal vein (point b) cross the disc margin. Side a-f and the line c-f make the angle θ between them. On the RNFL thickness deviation map (B), a similar triangle (gray triangle) was constructed with 2 corners at the points where the temporal borders of the superior temporal retinal vein (point a’) and the inferior temporal retinal vein (point b’) cross the disc margin and side a*-b*. The other corner of the triangle was point f*. Angle θ was measured and a line was drawn to the optic disc (black line). Finally, point R was marked where the scan circle and the line met.
Fig 2
Fig 2. Histograms showing the distributions of the signed, absolute and fractional interocular differences in average RNFL thickness of subjects.
Fig 3
Fig 3. Mean retinal nerve fiber layer (RNFL) thickness and interocular RNFL thickness difference of the study population (n = 260) before and after correction for ocular cyclotorsion.
A. The mean RNFL thickness before correction for ocular cyclotorsion. B. The mean RNFL thickness after correction for ocular cyclotorsion. C. The mean fractional interocular RNFL thickness difference. D. The mean absolute interocular RNFL thickness difference. E. The mean signed interocular RNFL thickness difference. (In A and B: straight line, right eye; dotted line, left eye. In C, D, and E: straight line, ocular cyclotorsion corrected value; dotted line, original value)(TEMP = Temporal, SUP = Superior, NAS = Nasal, INF = Inferior).
Fig 4
Fig 4. Percentile distributions of interocular RNFL thickness difference.
A. The percentile distributions of the fractional interocular RNFL thickness difference. B. The percentile distributions of the absolute interocular RNFL thickness difference. C. The percentile distributions of the signed interocular RNFL thickness difference. (White zone, within the 95th percentile distribution; light gray zone, between the 95th and 99th percentile distribution; dark gray zone, outside the 99th percentile distribution)(TEMP = Temporal, SUP = Superior, NAS = Nasal, INF = Inferior).
Fig 5
Fig 5. Mean RNFL thickness of subgroups classified by the location of the superior peak thickness after correction for ocular cyclotorsion (A, B and C) and comparison of interocular RNFL thickness differences between the subgroups (D and E).
A. Mean RNFL thickness of group 1 (subjects in whom the corrected location point of the superior peak was ≤ 48.78 in 1 or both eyes, n = 44). B. Mean RNFL thickness of group 2 (subjects in whom the corrected location point of the superior peak was between 48.78 and 62.86 in both eyes, n = 160). C. Mean RNFL thickness of group 3 (subjects in whom the corrected location point of the superior peak was ≥ 62.86 in 1 or both eyes, n = 56). D. The mean fractional interocular RNFL thickness differences. E. The mean absolute interocular RNFL thickness differences. [Straight line, right eye; dotted line, left eye; red line, group 1; black line, group 2; blue line, group 3; arrow heads, the mean locations of the superior peak RNFL thickness; gray zone, the area where the difference is statistically significant (P<0.05 Kruskal Wallis test)](TEMP = Temporal, SUP = Superior, NAS = Nasal, INF = Inferior).
Fig 6
Fig 6. Mean RNFL thickness of subgroups classified by the location of the inferior peak thickness after correction for ocular cyclotorsion (A, B and C) and comparison of interocular RNFL thickness differences between the subgroups (D and E).
A. Mean RNFL thickness of group 4 (subjects in whom the corrected location point of the inferior peak was ≤ 202.16 in 1 or both eyes, n = 62). B. Mean RNFL thickness of group 5 (subjects in whom the corrected location point of the inferior peak was between 202.16 and 217.75 in both eyes, n = 145). C. Mean RNFL thickness of group 6 (subjects in whom the corrected location point of the inferior peak was ≥ 217.75 in 1 or both eyes, n = 53). D. The mean fractional interocular RNFL thickness differences. E. The mean absolute interocular RNFL thickness differences. [Straight line, right eye; dotted line, left eye; red line, group 6; black line, group 5; blue line, group 4; arrow heads, the mean locations of the superior peak RNFL thickness; gray zone, the area where the difference is statistically significant (P<0.05 by Kruskal Wallis test)](TEMP = Temporal, SUP = Superior, NAS = Nasal, INF = Inferior).

References

    1. Leung CK, Cheung CY, Weinreb RN, Qiu Q, Liu S, et al. Retinal nerve fiber layer imaging with spectral-domain optical coherence tomography. Ophthalmology. 2009;116:1257–63. 10.1016/j.ophtha.2009.04.013 - DOI - PubMed
    1. Budenz DL, Michael A, Chang RT, McSoley J, Katz J. Sensitivity and specificity of the stratus OCT for perimetric glaucoma. Ophthalmology. 2005;112:3–9. - PubMed
    1. Hood DC, Harizman N, Kanadani FN, Grippo TM, Baharestani S, et al. Retinal nerve fiber thickness measured with optical coherence tomography (OCT) accurately detects confirmed glaucomatous damage. Br J Ophthalmol. 2007;91:901–904. - PMC - PubMed
    1. Hougaard JL, Heiji A, Bengtsson B. Glaucoma detection using different stratus optical coherence tomography protocols. Acta Ophthalmol Scand. 2007;85:251–256. - PubMed
    1. Kanamori A, Nagai-Kusuhara A, Escano MF, Maeda H, Nakamura M, et al. Comparison of confocal scanning laser ophthalmoscopy, scanning laser polarimetry and optical coherence tomography to discriminate ocular hypertension and glaucoma at an early stage. Graefes Arch Clin Exp Ophthalmol. 2006;244:58–68. - PubMed

Publication types

LinkOut - more resources