. 2015 Feb 13;11(2):e1004994.
doi: 10.1371/journal.pgen.1004994. eCollection 2015 Feb.

Discovery of transcription factors and regulatory regions driving in vivo tumor development by ATAC-seq and FAIRE-seq open chromatin profiling

Affiliations

Discovery of transcription factors and regulatory regions driving in vivo tumor development by ATAC-seq and FAIRE-seq open chromatin profiling

Kristofer Davie et al. PLoS Genet. .

Abstract

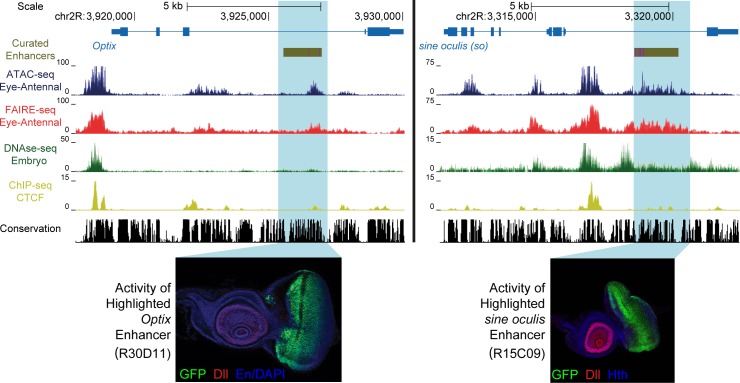
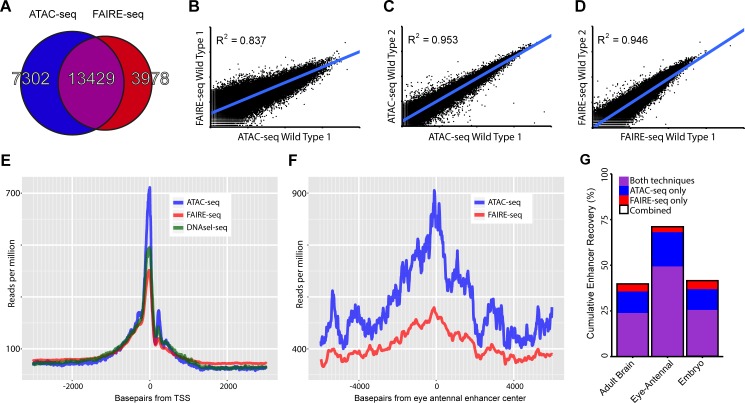
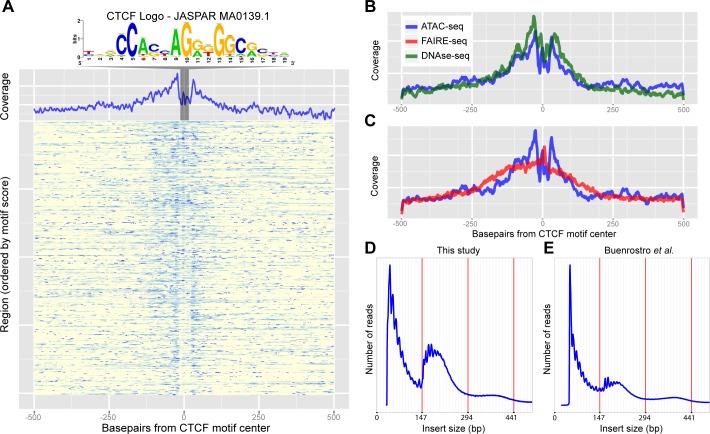
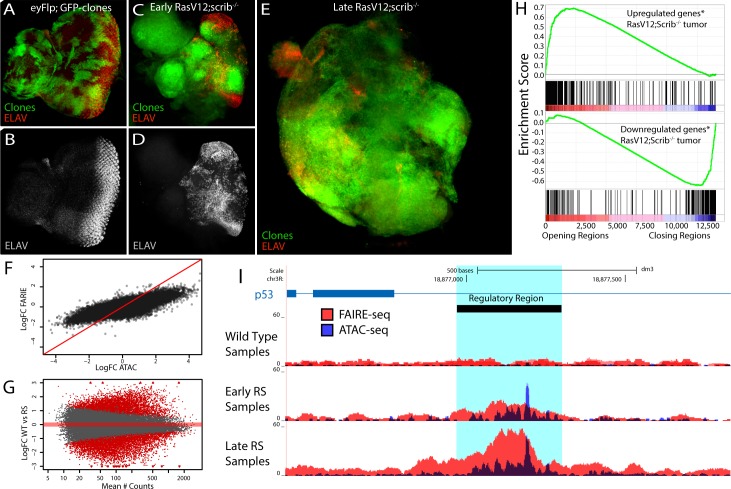
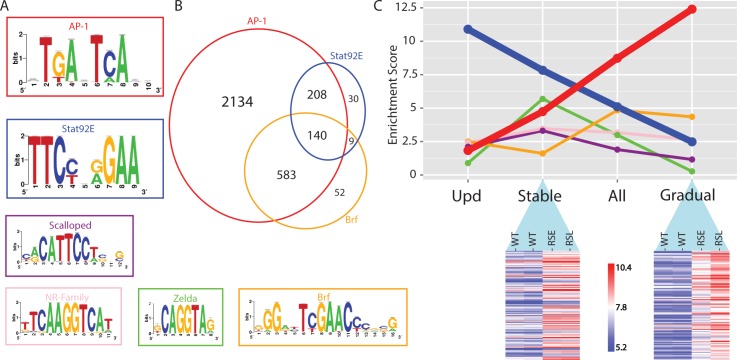
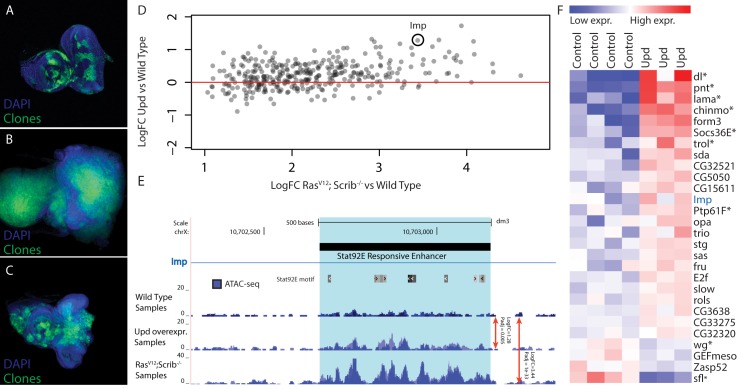
Genomic enhancers regulate spatio-temporal gene expression by recruiting specific combinations of transcription factors (TFs). When TFs are bound to active regulatory regions, they displace canonical nucleosomes, making these regions biochemically detectable as nucleosome-depleted regions or accessible/open chromatin. Here we ask whether open chromatin profiling can be used to identify the entire repertoire of active promoters and enhancers underlying tissue-specific gene expression during normal development and oncogenesis in vivo. To this end, we first compare two different approaches to detect open chromatin in vivo using the Drosophila eye primordium as a model system: FAIRE-seq, based on physical separation of open versus closed chromatin; and ATAC-seq, based on preferential integration of a transposon into open chromatin. We find that both methods reproducibly capture the tissue-specific chromatin activity of regulatory regions, including promoters, enhancers, and insulators. Using both techniques, we screened for regulatory regions that become ectopically active during Ras-dependent oncogenesis, and identified 3778 regions that become (over-)activated during tumor development. Next, we applied motif discovery to search for candidate transcription factors that could bind these regions and identified AP-1 and Stat92E as key regulators. We validated the importance of Stat92E in the development of the tumors by introducing a loss of function Stat92E mutant, which was sufficient to rescue the tumor phenotype. Additionally we tested if the predicted Stat92E responsive regulatory regions are genuine, using ectopic induction of JAK/STAT signaling in developing eye discs, and observed that similar chromatin changes indeed occurred. Finally, we determine that these are functionally significant regulatory changes, as nearby target genes are up- or down-regulated. In conclusion, we show that FAIRE-seq and ATAC-seq based open chromatin profiling, combined with motif discovery, is a straightforward approach to identify functional genomic regulatory regions, master regulators, and gene regulatory networks controlling complex in vivo processes.


Conflict of interest statement

The authors have declared that no competing interests exist.

Figures

Fig 1
Fig 1. Enhancer identification in the eye primordium by ATAC-seq and FAIRE-seq.
Two example eye-related genes from the Drosophila melanogaster genome (dm3). Tracks shown include: experimentally validated enhancers from ORegAnno and REDFly [72,73] (shown in Gold), coverage data in the eye-antennal disc for ATAC-seq (Blue), FAIRE-seq (Red) and CTCF ChIP (Yellow), DNaseI-seq (Green) from whole stage 11 embryos [8] and finally sequence conservation across 14 Drosophila species (Black). On the left the gene locus of Optix is shown. The region in gold is a known enhancer with binding sites for Eyeless overlaid in purple, with FlyLight enhancer activity of R30D11 below. This region is identified as a peak in both ATAC-seq and FAIRE-seq in the eye, but not in embryonic DNaseI-seq. On the right is the gene locus of sine oculis (so). The region in gold is a known enhancer with binding sites for Eyeless and Twin of Eyeless overlaid in purple. The reporter activity of this enhancer (R15C09) is shown by the Janelia Farm FlyLight project. Again, this enhancer is identified as a peak in both ATAC-seq and FAIRE-seq but not in embryonic DNaseI-seq. In both examples, peaks can be seen in the CTCF ChIP-seq data corresponding to regions identified as open by all three other techniques. Some small differences between ATAC-seq and FAIRE-seq can also be seen, including a higher background signal for FAIRE-seq. Images obtained from the FlyLight database (http://flweb.janelia.org/cgi-bin/flew.cgi).
Fig 2
Fig 2. Comparing general features of ATAC-seq and FAIRE-seq.
(A) Venn diagram of peaks called for each technique and the overlap between techniques. (B-D) Correlation plots for replicates of both techniques showing normalized read counts for the entire genome split into regions based on conservation [32]. Both techniques correlate very well within techniques (r2 ∼ 0.95) despite each wild type sample being from different D.melanogaster genetic backgrounds. Correlation between the techniques on the same sample was 0.837; in this case FAIRE-seq seems to reach a limit of signal strength before ATAC-seq does. (E) Aggregation plot showing the aggregated signal for each technique across all transcription start sites (TSS) throughout the genome with a 2.5kb window on either side. Although each technique is enriched exactly at the TSS, there are large differences in the size of this peak, despite being normalized to the total read count within these regions. Note that the background level of FAIRE-seq is higher than that of ATAC-seq and DNaseI-seq which are roughly equal, indicating increased noise level in FAIRE-seq. (F) Aggregation plot showing the aggregated signal for ATAC-seq and FAIRE-seq across all Janelia Farm eye-antennal enhancers with a 5kb window on either side. A more distinct peak can be seen in ATAC-seq which also has a higher level overall, due to the fact that it recovers more enhancers than FAIRE-seq. (G) Sets of enhancers known to be expressed in specific tissues were extracted from the FlyLight database [21], these were then compared with the peaks identified from our ATAC-seq and FAIRE-seq data. The set with the most number of enhancers recovered was the eye-antennal enhancers with a total of 71.01% recovered, whilst 49.31% were recovered by both techniques, an extra 18.75% were identified by ATAC-seq only and 2.95% were identified by FAIRE-seq only.
Fig 3
Fig 3. Recovery of known enhancers and CTCF footprinting by ATAC-seq.
(A) Heatmap of ATAC-seq Tn5 transposase cut site occurrence in 500bp around 805 CTCF ChIP peaks centered on the JASPAR-MA0139.1 (CTCF) motif, highlighted and shown above. An aggregation plot shows the overall profile and protection at the motif. (B-C) Comparisons of the DNaseI-seq and FAIRE-seq cut sites respectively with the ATAC-seq profile. DNaseI-seq has a very similar profile whilst FAIRE-seq shows enrichment around the motif but with no protection. (D-E) Histograms showing the frequency of insert sizes from both this study in Drosophila (D) and the study by Buenrostro et al. in humans (E) [24]. Red lines indicate the amount of DNA bound by one, two and three nucleosomes.
Fig 4
Fig 4. The tumor chromatin landscape.
(A-E) Confocal images of eye imaginal discs, clones are indicated by GFP expression (green) and neuronal differentiation is visualized by an ELAV staining (red or grey). (A-B) Control disc showing a normal photoreceptor differentiation pattern (y,w,eyFlp; act>y+>Gal4, UAS-GFP; FRT82). (C-D) Early oncogenesis (day7), the clones are homozygous scribble mutant and overexpress Rasv12 (RasV12; scrib -/-), changing the morphology of the disc and blocking photoreceptor differentiation (y,w,eyFlp; act>y+>Gal4, UAS-GFP, UAS-RasV12; FRT82 scrib2-,e). (E) Late oncogenesis (day 9), the clones have overgrown neighboring tissue and formed a massive tumor. (F) Comparing the log fold change of the differential peaks between tumor and wild type, for FAIRE (y-axis) and ATAC (x-axis) shows the greater dynamic range of ATAC. (G) MA-plot of the 36506 peaks with their mean number of counts (x-axis) and their log fold change between wild type and RasV12; scrib -/- (y-axis). 11516 peaks (red) are called significantly different (padj < 0.01) by DESeq2 using the batch effect (see Materials and Methods). (H) Gene Set Enrichment Analysis plots showing a strong correlation between genes [69] up regulated in RasV12; scrib -/- tumors and the opening of nearby regulatory regions (top) and vice versa (bottom). (I) Example of a gradually opening regulatory region in an intron of p53, a known tumor suppressor gene with significantly increased expression in these tumors (logFC = 0.73, padj < 0.0017).
Fig 5
Fig 5. Regulator detection by motif inference.
(A) Motifs enriched in the activity-gaining enhancers for the transcription factors AP-1, Stat92E, Scalloped, nuclear receptor family, Zelda and Brf. (B) Venn diagram of the tumor-specific enhancers that are predicted to be responsive to AP-1, Stat92E and Brf transcription factors. (C) The motif enrichment score (i-cisTarget) of the six transcription factors plotted for each of the four different enhancer groups; opening after Upd-overexpression (activating Stat92E), Stably opening enhancers, All opening enhancers and Gradually opening enhancers in RasV12;Scrib-/- tumors. The heatmaps are representing a subset of the regions that are classified as stably or gradually opening. A variance stabilizing transformation (DESeq2) was performed on the count data, blue indicates low and red indicates high peak intensity.
Fig 6
Fig 6. Validation of Stat92E as a key regulator during RasV12; scrib -/- oncogenesis.
(A-C) Confocal images of eye-antennal imaginal discs, clones are indicated in green and DAPI in blue. (A) Wild type disc from a 5 day old larva with MARCM clones expressing GFP (B) An eye-antennal tumor taken from an 8 day old larva with the RasV12; scrib -/- clones. (C) An eye-antennal disc from an 8 day old larva with the RasV12; Stat92E85c9, scrib -/- clones, showing partial rescue of the tumor phenotype. (D) Opening of predicted Stat92E enhancers from RasV12 ; scrib -/- tumors vs wild type (x-axis), compared to the opening of these enhancers when ectopically activating the JAK/STAT signaling pathway vs wild type (y-axis). (E) Predicted Stat92E enhancer region inside an intron of Imp, the enhancer is significantly more active in the Upd eye discs compared to wild type (logFC 1.28 padj 0.005) and even more so in the RasV12; scrib -/- tumors compared to wild type (logFC 3.44 padj 1e-33). (F) Heatmap showing the expression level of 28 genes [42] that have at least one activated enhancer predicted to be Stat92E responsive (Fig. 6A).

References

    1. Thurman RE, Rynes E, Humbert R, Vierstra J, Maurano MT, et al. (2012) The accessible chromatin landscape of the human genome. Nature 489: 75–82. 10.1038/nature11232 - DOI - PMC - PubMed
    1. Dunham I, Kundaje A, Aldred SF, Collins PJ, Davis CA, et al. (2012) An integrated encyclopedia of DNA elements in the human genome. Nature 489: 57–74. 10.1038/nature11247 - DOI - PMC - PubMed
    1. Jones PA (2012) Functions of DNA methylation: islands, start sites, gene bodies and beyond. Nat Rev Genet 13: 484–492. 10.1038/nrg3230 - DOI - PubMed
    1. Andersson R, Gebhard C, Miguel-Escalada I, Hoof I, Bornholdt J, et al. (2014) An atlas of active enhancers across human cell types and tissues. Nature 507: 455–461. 10.1038/nature12787 - DOI - PMC - PubMed
    1. Ernst J, Kellis M (2010) Discovery and characterization of chromatin states for systematic annotation of the human genome. Nat Biotechnol 28: 817–825. 10.1038/nbt.1662 - DOI - PMC - PubMed

Publication types

Associated data