

Is yield increase sufficient to achieve food security in China?
- PMID: 25680193
- PMCID: PMC4332688
- DOI: 10.1371/journal.pone.0116430
Is yield increase sufficient to achieve food security in China?
Erratum in
-
Correction: Is Yield Increase Sufficient to Achieve Food Security in China?PLoS One. 2019 Aug 30;14(8):e0222167. doi: 10.1371/journal.pone.0222167. eCollection 2019. PLoS One. 2019. PMID: 31469879 Free PMC article.
Abstract
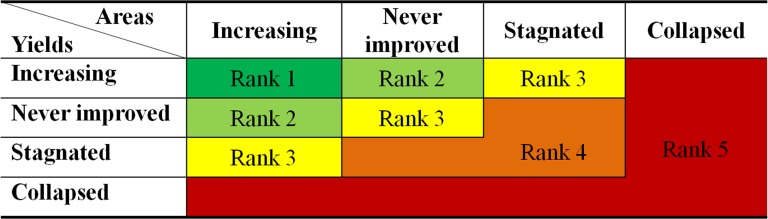
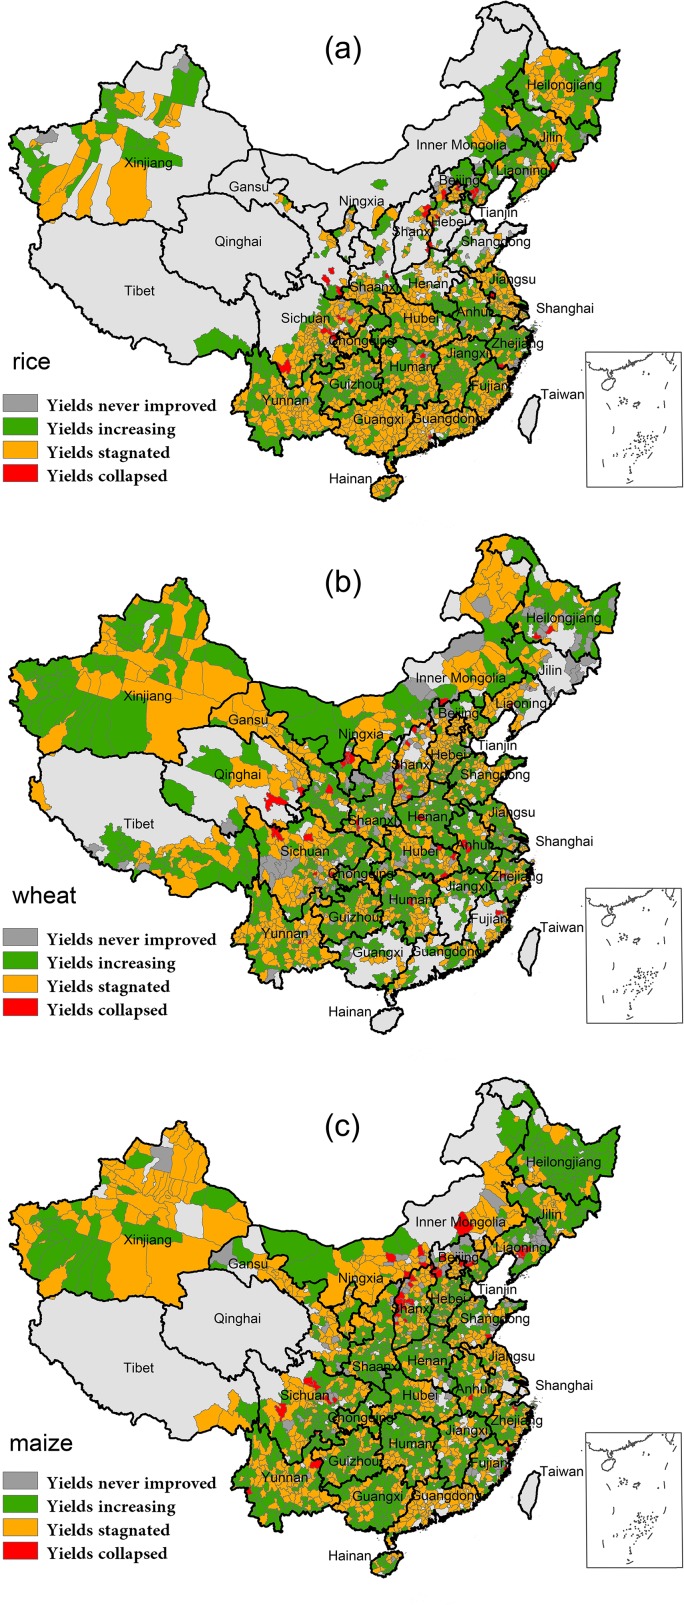
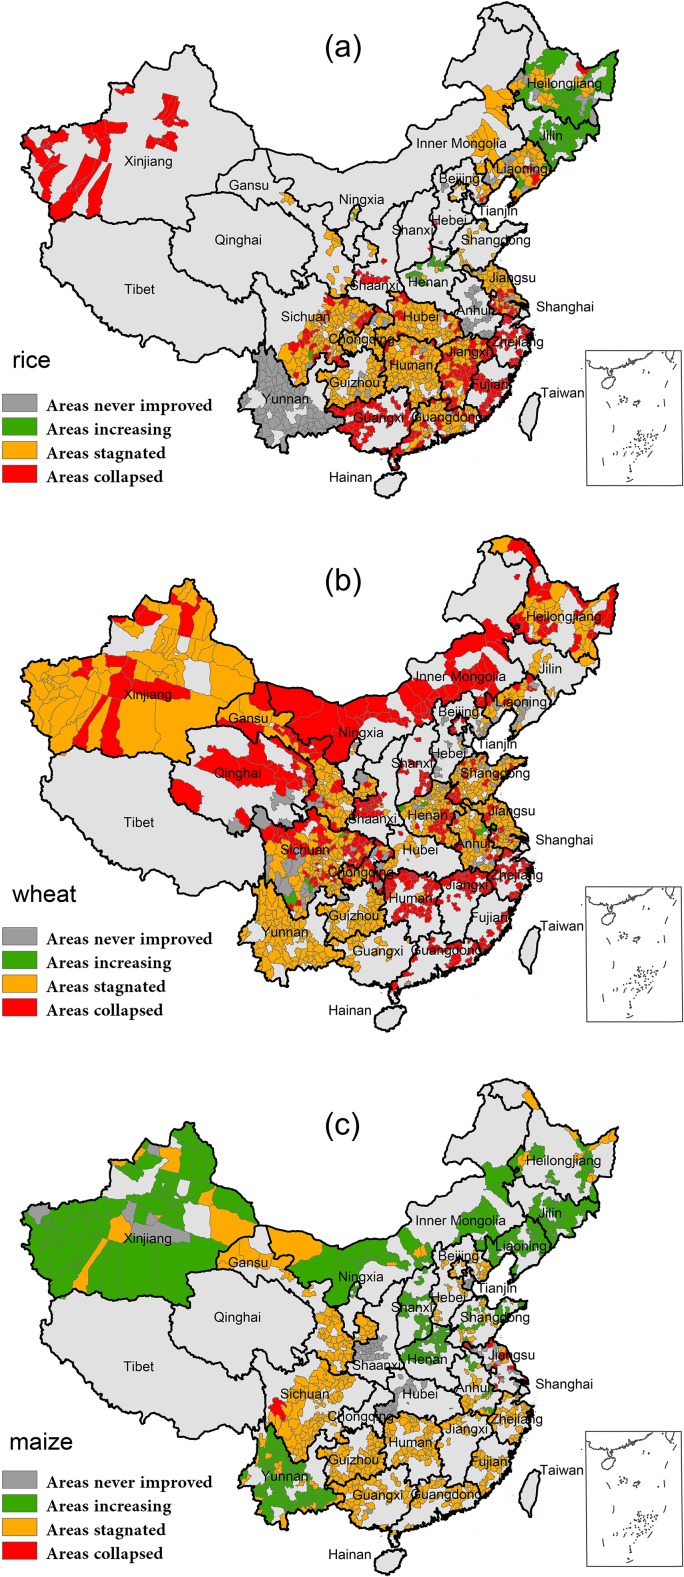
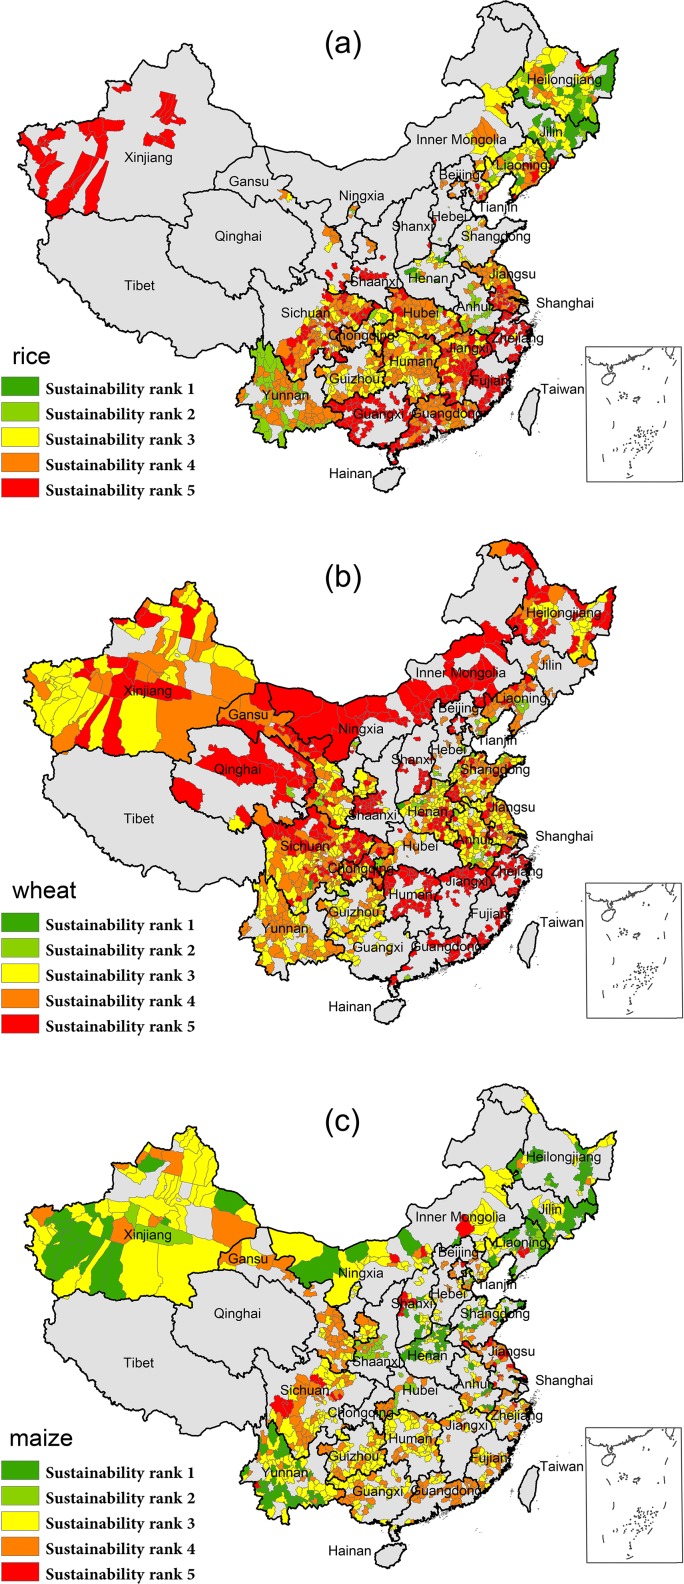
Increasing demand for food, driven by unprecedented population growth and increasing consumption, will keep challenging food security in China. Although cereal yields have substantially improved during the last three decades, whether it will keep thriving to meet the increasing demand is not known yet. Thus, an integrated analysis on the trends of crop yield and cultivated area is essential to better understand current state of food security in China, especially on county scale. So far, yield stagnation has extensively dominated the main cereal-growing areas across China. Rice yield is facing the most severe stagnation that 53.9% counties tracked in the study have stagnated significantly, followed by maize (42.4%) and wheat (41.9%). As another important element for production sustainability, but often neglected is the planted area patterns. It has been further demonstrated that the loss in productive arable land for rice and wheat have dramatically increased the pressure on achieving food security. Not only a great deal of the planted areas have stagnated since 1980, but also collapsed. 48.4% and 54.4% of rice- and wheat-growing counties have lost their cropland areas to varying degrees. Besides, 27.6% and 35.8% of them have retrograded below the level of the 1980s. The combined influence (both loss in yield and area) has determined the crop sustainable production in China to be pessimistic for rice and wheat, and consequently no surprise to find that more than half of counties rank a lower level of production sustainability. Therefore, given the potential yield increase in wheat and maize, as well as substantial area loss of rice and wheat, the possible targeted adaptation measures for both yield and cropping area is required at county scale. Moreover, policies on food trade, alongside advocation of low calorie diets, reducing food loss and waste can help to enhance food security.
Conflict of interest statement
Figures
References
-
- Peng S, Cassman KG, Virmani S, Sheehy J, Khush G (1999) Yield potential trends of tropical rice since the release of IR8 and the challenge of increasing rice yield potential.
-
- Fan X-M, Kang MS, Chen H, Zhang Y, Tan J, et al. (2007) Yield stability of maize hybrids evaluated in multi-environment trials in Yunnan, China. Agronomy Journal 99: 220–228.
Publication types
MeSH terms
LinkOut - more resources
Full Text Sources
Other Literature Sources
Research Materials
