Comparative Study
. 2015 May;94(5):715-21.
doi: 10.1177/0022034515570943. Epub 2015 Feb 13.

Functional differences in the acinar cells of the murine major salivary glands

Affiliations
Comparative Study

Functional differences in the acinar cells of the murine major salivary glands

Y Kondo et al. J Dent Res. 2015 May.

Abstract

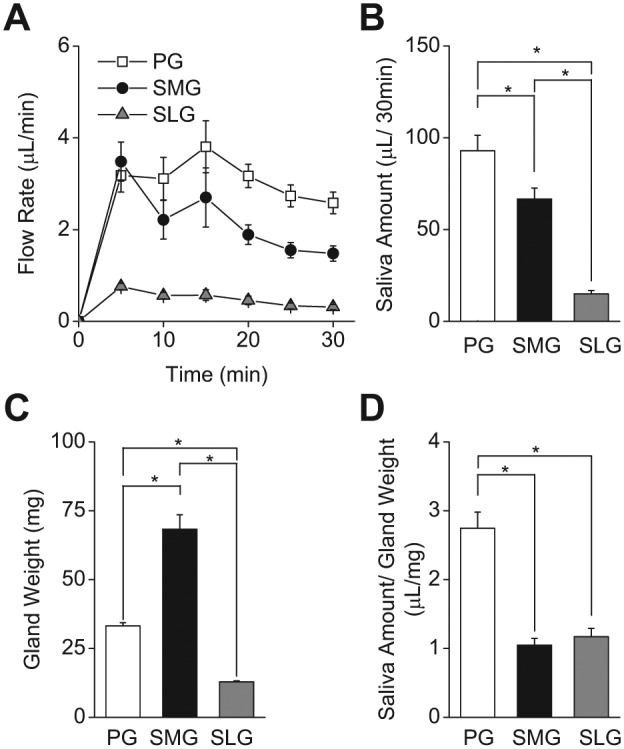
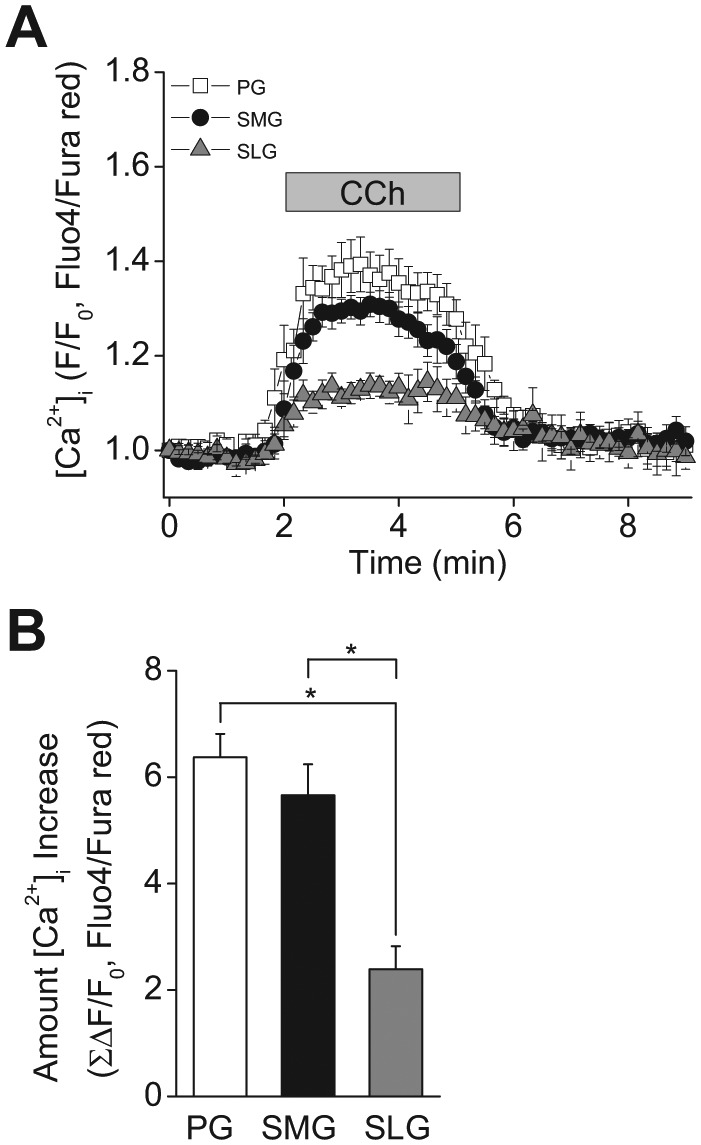
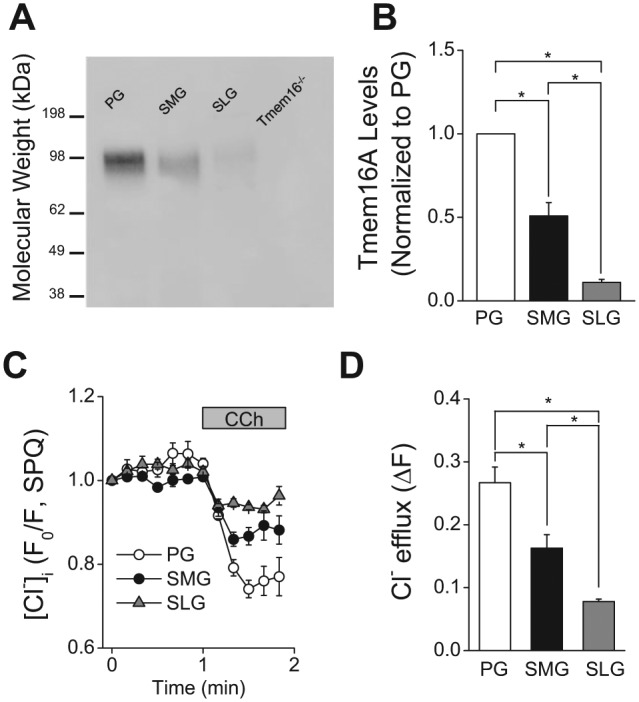
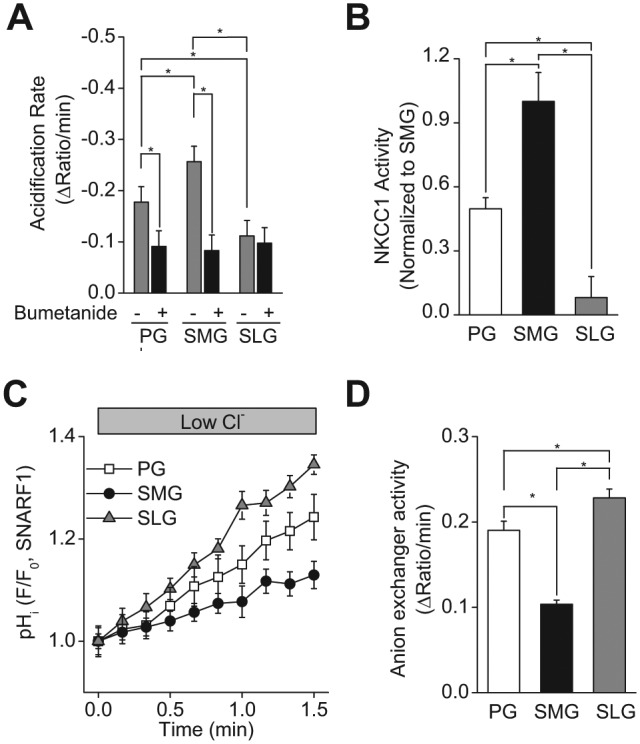
In humans, approximately 90% of saliva is secreted by the 3 major salivary glands: the parotid (PG), the submandibular (SMG), and the sublingual glands (SLG). Even though it is known that all 3 major salivary glands secrete saliva by a Cl(-)-dependent mechanism, salivary secretion rates differ greatly among these glands. The goal of this study was to gain insight into the properties of the ion-transporting pathways in acinar cells that might account for the differences among the major salivary glands. Pilocarpine-induced saliva was simultaneously collected in vivo from the 3 major salivary glands of mice. When normalized by gland weight, the amount of saliva secreted by the PG was more than 2-fold larger than that obtained from the SMG and SLG. At the cellular level, carbachol induced an increase in the intracellular [Ca(2+)] that was more than 2-fold larger in PG and SMG than in SLG acinar cells. Carbachol-stimulated Cl(-) efflux and the protein levels of the Ca(2+)-activated Cl(-) channel TMEM16A, the major apical Cl(-) efflux pathway in salivary acinar cells, were significantly greater in PG compared with SMG and SLG. In addition, we evaluated the transporter activity of the Na(+)-K(+)-2Cl(-) cotransporters (NKCC1) and anion exchangers (AE), the 2 primary basolateral Cl(-) uptake mechanisms in acinar cells. The SMG NKCC1 activity was about twice that of the PG and more than 12-fold greater than that of the SLG. AE activity was similar in PG and SLG, and both PG and SLG AE activity was about 2-fold larger than that of SMG. In summary, the salivation kinetics of the 3 major glands are distinct, and these differences can be explained by the unique functional properties of each gland related to Cl(-) movement, including the transporter activities of the Cl(-) uptake and efflux pathways, and intracellular Ca(2+) mobilization.

Keywords: Na-K-Cl transporter; calcium signaling; chloride channel; epithelia; physiology; salivary physiology.


Conflict of interest statement

The authors declare no potential conflicts of interest with respect to the authorship and/or publication of this article.

Figures

Figure 1.
Figure 1.
Pilocarpine induced in vivo salivation from mouse parotid (PG), submandibular (SMG), and sublingual glands (SLG). (A) Flow rate (µL/min) of pilocarpine (10 mg/kg)-stimulated, gland-specific saliva was collected for 30 min from PG (open squares), SMG (filled circles), and SLG (gray triangles). (B) Total amount of secreted saliva during 30 min of stimulation (µL/30 min). Secreted saliva was significantly greater in PG, followed by SMG and SLG. (C) Average gland weight (mg) was significantly greater in SMG, followed by PG and SLG. (D) Amount of saliva normalized by gland weight (µL/mg). Saliva amount per gland weight was significantly greater in PG than in SMG and SLG, while SMG and SLG were not different. One-way ANOVA followed by Bonferroni’s post hoc test was applied for the detection of statistically significant differences. *P < 0.05; n = 24 (males = 12, females = 12).
Figure 2.
Figure 2.
Acinar and ductal cross-sectional areas in mouse parotid (PG), submandibular (SMG), and sublingual glands (SLG). Salivary gland tissue slices from ACID/ROSAmT/mG mice were used to estimate the acinar and ductal cross-sectional areas in mouse PG, SMG, and SLG. ACID/ROSAmT/mG mice express green fluorescent acinar regions and red fluorescent ducts. (A–C) Fluorescence images of mouse PG, SMG, and SLG, respectively. (D) Summary of acinar and ductal areas in PG, SMG, and SLG. Acinar cross-sectional areas in PG and SLG were significantly larger than in SMG. One-way ANOVA followed by Bonferroni’s post hoc test was applied for the detection of statistically significant differences. *P < 0.05; n = 6 (males = 3, females = 3). Bars = 50 µm.
Figure 3.
Figure 3.
Muscarinic stimulation induced [Ca2+]i increase in mouse parotid (PG), submandibular (SMG), and sublingual (SLG) acinar cells. [Ca2+]i was measured in Fluo4- and Fura Red-loaded tissue slices. (A) Time-course of the [Ca2+]i increase in response to 0.3 μM Carbachol (CCh, when indicated by the bar) in mouse (C57BL6) PG, SMG, and SLG acinar cells. (B) Magnitude of the [Ca2+]i increase during stimulation in mouse acinar cells calculated from the area under the curve. PG and SMG showed significantly greater stimulated [Ca2+]i increases than did SLG. One-way ANOVA followed by Bonferroni’s post hoc test was applied for the detection of statistically significant differences. *P < 0.05. n = 6 (males = 3, females = 3).
Figure 4.
Figure 4.
TMEM16A protein expression and muscarinic receptor-activated decrease in [Cl-]i in mouse parotid (PG), submandibular (SMG), and sublingual gland (SLG) acinar cells. (A) Western blot analysis with an anti-TMEM16A antibody was performed as described in the “Appendix Materials and Methods” section by loading 10 μg of acinar protein/lane isolated from mouse (C57BL/6) PG, SMG, and SLG. The specificity of the anti-TMEM16A antibody was confirmed by the absence of a reactive band in the lane loaded with SMG protein from a mouse lacking TMEM16A (Tmem16A-/-). (B) Summary of 4 independent experiments performed on individual protein samples obtained from 4 mice (2 females and 2 males). Band intensities (obtained by densitometric analysis with ImageJ software) were normalized by the intensity obtained from PG in each separate blot, which displayed the highest expression level among major salivary glands. (C) Changes in [Cl-]i in response to 0.3 µM CCh were measured in SPQ-loaded cells from mouse (C57BL/6) PG, SMG, and SLG. (D) Summary of the magnitude of the [Cl-]i decrease in PG, SMG, and SLG acinar cells from mouse (C57BL/6). The [Cl-]i decrease was significantly greater in the PG, followed by the SMG and then the SLG. One-way ANOVA followed by Bonferroni’s post hoc test was applied for the detection of statistically significant differences. *P < 0.05. n = 4 (males = 2, females = 2).
Figure 5.
Figure 5.
Na+-K+-2Cl- cotransporter (NKCC1) and Cl-/HCO3- anion exchanger activities in mouse parotid (PG), submandibular (SMG), and sublingual gland (SLG) acinar cells. Intracellular pH (pHi) was measured in SNARF1-loaded tissue slices. Na+-K+-2Cl- cotransporter activity was monitored as the bumetanide-sensitive (50 μM of the Na+-K+-2Cl- cotransporter inhibitor) acidification rate following the perfusion of a 30 mM NH4Cl containing external solution. (A) Summary of the acidification rates in mouse (C57BL/6) PG, SMG, and SLG acinar cells with or without bumetanide. Bumetanide decreased the acidification rate in acinar cells from SMG and PG, but had no significant effect on SLG acidification. (B) Summary of the bumetanide-sensitive NKCC1 activity in PG, SMG, and SLG acinar cells. NKCC1 activity was significantly greater in SMG, followed by PG and then SLG. The values were normalized to the value obtained from SMG, which displayed the highest NKCC1 activity among major salivary glands. (C) Representative experiments showing pHi changes mediated by Cl-/HCO3- anion exchanger activity in response to a low Cl- solution in mouse (C57BL/6) PG (open squares), SMG (filled circles), and SLG (gray triangles) acinar cells. (D) Summary of the Cl-/HCO3- exchanger-dependent alkalization rates in mouse (C57BL/6) PG, SMG, and SLG acinar cells. The alkalization rate was significantly greater in SLG, followed by PG and then SMG. One-way ANOVA followed by Bonferroni’s post hoc test was applied for the detection of statistically significant differences.*P < 0.05. n = 6 (males = 3, females = 3).

References

    1. Ambudkar IS. 2014. Ca(2)(+) signaling and regulation of fluid secretion in salivary gland acinar cells. Cell Calcium. 55(6):297–305. - PMC - PubMed
    1. Caputo A, Caci E, Ferrera L, Pedemonte N, Barsanti C, Sondo E, Pfeffer U, Ravazzolo R, Zegarra-Moran O, Galietta LJ. 2008. TMEM16A, a membrane protein associated with calcium-dependent chloride channel activity. Science. 322(5901):590–594. - PubMed
    1. Dawes C, Wood CM. 1973. The contribution of oral minor mucous gland secretions to the volume of whole saliva in man. Arch Oral Biol. 18(3):337–342. - PubMed
    1. Edgar WM. 1990. Saliva and dental health. Clinical implications of saliva: report of a consensus meeting. Br Dent J. 169(3-4):96–98. - PubMed
    1. Evans RL, Park K, Turner RJ, Watson GE, Nguyen HV, Dennett MR, Hand AR, Flagella M, Shull GE, Melvin JE. 2000. Severe impairment of salivation in Na+/K+/2Cl- cotransporter (NKCC1)-deficient mice. J Biol Chem. 275(35):26720–26726. - PubMed

Publication types

MeSH terms