. 2015 Apr;66(7):1907-18.
doi: 10.1093/jxb/eru535. Epub 2015 Feb 13.

The transcription factor PHR1 regulates lipid remodeling and triacylglycerol accumulation in Arabidopsis thaliana during phosphorus starvation

Affiliations

The transcription factor PHR1 regulates lipid remodeling and triacylglycerol accumulation in Arabidopsis thaliana during phosphorus starvation

Bikram Datt Pant et al. J Exp Bot. 2015 Apr.

Abstract

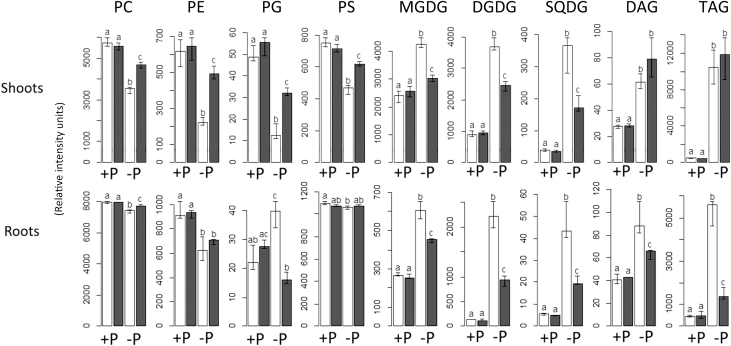
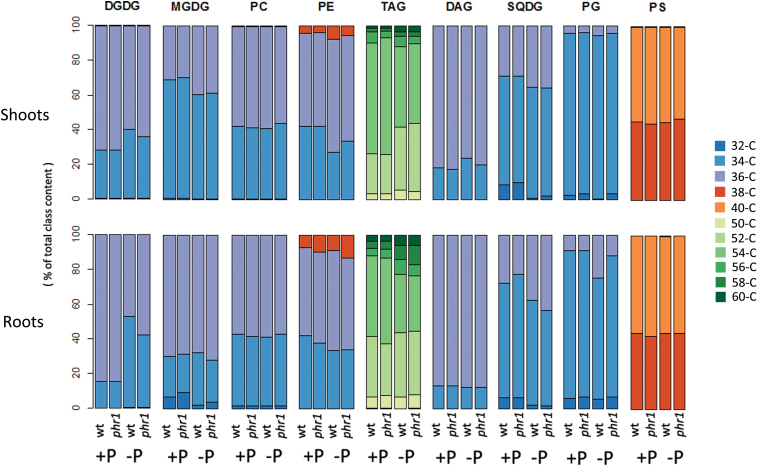
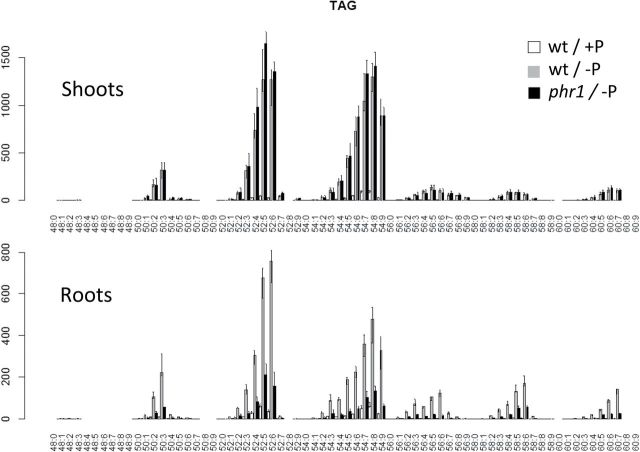
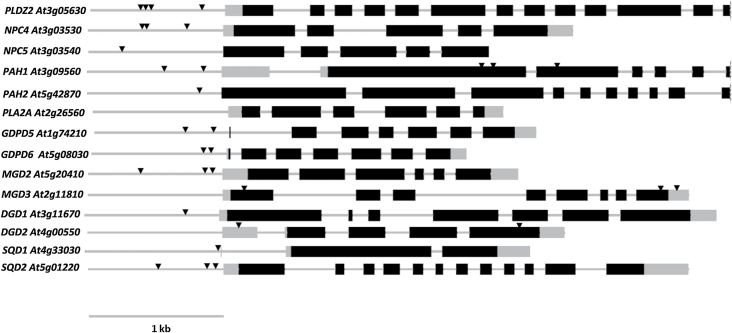
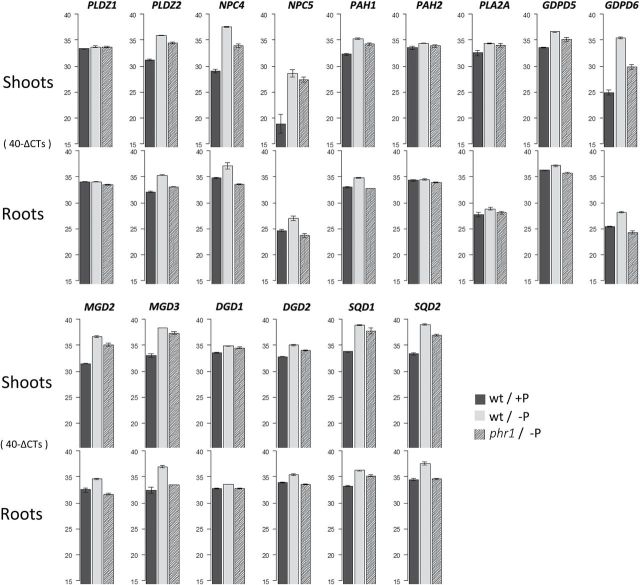
Lipid remodeling is one of the most dramatic metabolic responses to phosphorus (P) starvation. It consists of the degradation of phospholipids to release the phosphate needed by the cell and the accumulation of glycolipids to replace phospholipids in the membranes. It is shown that PHR1, a well-described transcriptional regulator of P starvation of the MYB family, largely controls this response. Glycerolipid composition and the expression of most lipid-remodeling gene transcripts analysed were altered in the phr1 mutant under phosphate starvation in comparison to wild-type plants. In addition to these results, the lipidomic characterization of wild-type plants showed two novel features of the lipid response to P starvation for Arabidopsis. Triacylglycerol (TAG) accumulates dramatically under P starvation (by as much as ~20-fold in shoots and ~13-fold in roots), a response known to occur in green algae but hardly known in plants. Surprisingly, there was an increase in phosphatidylglycerol (PG) in P-starved roots, a response that may be adaptive as it was suppressed in the phr1 mutant.

Keywords: Lipidomics; PHO2; PHR1; lipid remodeling; microRNA399; phosphorus starvation; triacylglycerol..


Figures

Fig 1.
Fig 1.
The change in lipid composition induced by P starvation is strongly influenced by the transcription factor PHR1. Values shown are the total content for each class in each condition. White bars represent wild-type plants and black bars represent phr1 mutants. Units shown are relative and represent normalized intensities. The height of the bars indicates the median value. Error bars represent the interval between the first and the third quartiles. Letters (a–c) indicate statistical groups according to pairwise t-tests.
Fig. 2.
Fig. 2.
P starvation changes the composition of glycerolipid classes. Values show the percentage contribution of the different acyl groups (groups of lipid species with the same number of acyl carbons) to the total class content, the sum of the normalized intensities of all the compounds belonging to the same class.
Fig. 3.
Fig. 3.
P starvation causes the accumulation of TAG in Arabidopsis. The factor PHR1 mediates this effect in roots but not in shoots according to UPLC-MS lipid profiling. Values shown are median relative intensities corresponding to wild-type plants growing at 3mM Pi (white bars) and 0mM Pi (grey bars), and phr1 plants at 0mM Pi (black bars). Error bars represent the interval between the first and the third quartiles.
Fig. 4.
Fig. 4.
Genes involved in phospholipid degradation and glycolipid biosynthesis contain PHR1-binding sites (P1BS). Exons are shown as black boxes, the promoter and introns as a grey line, and UTRs as grey boxes. The position of P1BS sites in the promoters is indicated by triangles. The 1kb region upstream of the 5′ UTR was regarded as the promoter and was searched for P1BS elements together with the rest of the gene sequence.
Fig. 5.
Fig. 5.
Expression of most lipid-remodeling genes during P starvation is under the control of PHR1. The influence of PHR1 appears stronger in the root according to qRT–PCR data. The values are expressed in 40-∆CTs, where ∆CT is the difference between the CT (threshold cycle number) of a tested gene and the reference gene (UBQ10, AT4G05320). The highest value possible is 40, as a qPCR run stops after completing 40 cycles. Values shown correspond to wild-type plants growing at 3mM Pi (black bars) and 0mM Pi (grey bars), and phr1 plants at 0mM Pi (dashed bars). Bar heights represent the average of two technical and two biological replicates. Error bars depict one SD.

References

    1. Ariovich D, Cresswell CF. 1983. The effect of nitrogen and phosphorus on starch accumulation and net photosynthesis in 2 variants of Panicum maximum Jacq. Plant, Cell and Environment 6, 657–664.
    1. Aung K, Lin SI, Wu CC, Huang YT, Su CL, Chiou TJ. 2006. pho2, a phosphate overaccumulator, is caused by a nonsense mutation in a MicroRNA399 target gene. Plant Physiology 141, 1000–1011. - PMC - PubMed
    1. Awai K, Marechal E, Block MA, Brun D, Masuda T, Shimada H, Takamiya K, Ohta H, Joyard J. 2001. Two types of MGDG synthase genes, found widely in both 16:3 and 18:3 plants, differentially mediate galactolipid syntheses in photosynthetic and nonphotosynthetic tissues in Arabidopsis thaliana. Proceedings of the National Academy of Sciences, USA 98, 10960–10965. - PMC - PubMed
    1. Bari R, Pant BD, Stitt M, Scheible W-R. 2006. PHO2, microRNA399, and PHR1 define a phosphate-signaling pathway in plants. Plant Physiology 141, 988–999. - PMC - PubMed
    1. Browse J, Somerville C. 1991. Glycerolipid synthesis—biochemistry and regulation. Annual Review of Plant Physiology 42, 467–506.

Publication types

MeSH terms

LinkOut - more resources