. 2015 Apr;199(4):935-57.
doi: 10.1534/genetics.114.173617. Epub 2015 Feb 12.

Novel tools for genetic manipulation of follicle stem cells in the Drosophila ovary reveal an integrin-dependent transition from quiescence to proliferation

Affiliations

Novel tools for genetic manipulation of follicle stem cells in the Drosophila ovary reveal an integrin-dependent transition from quiescence to proliferation

Tiffiney R Hartman et al. Genetics. 2015 Apr.

Abstract

In many tissues, the presence of stem cells is inferred by the capacity of the tissue to maintain homeostasis and undergo repair after injury. Isolation of self-renewing cells with the ability to generate the full array of cells within a given tissue strongly supports this idea, but the identification and genetic manipulation of individual stem cells within their niche remain a challenge. Here we present novel methods for marking and genetically altering epithelial follicle stem cells (FSCs) within the Drosophila ovary. Using these new tools, we define a sequential multistep process that comprises transitioning of FSCs from quiescence to proliferation. We further demonstrate that integrins are cell-autonomously required within FSCs to provide directional signals that are necessary at each step of this process. These methods may be used to define precise roles for specific genes in the sequential events that occur during FSC division after a period of quiescence.

Keywords: adhesion; follicle stem cell; germarium; integrin; quiescence.


Figures

Figure 1
Figure 1
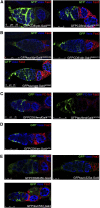
Gal4 expression in terminal filament and cap cells. (A) Schematic diagram showing somatic cell populations in the germarium, including terminal filament cells (blue), cap cells (magenta), germ-line stem cells (GSCs, orange), inner germarial sheath cells (IGS cells, also known as escort cells, turquoise), follicle stem cells (FSCs, green), follicle cells (immunostained with Fas3, blue), and germ cells (immunostained with Vasa, red). (B) Expression of previously reported Gal4 lines (bab-Gal4 and 109-53-Gal4) and Hh-pathway Gal4 insertions (hh-Gal4, boi-Gal4) in terminal filament and cap cells. (C) Five shaggy (sgg)-Gal4 lines exhibit expression in terminal filament and/or cap cells. (D) Gal4 insertions in unidentified genes exhibit expression in terminal filament and/or cap cells. Germaria in B–D are immunostained with Vasa (blue, germ cells) and either Fas3 (red, follicle cells) or FC-NA (red, high in FSCs and follicle cells). Scale bars are indicated.
Figure 2
Figure 2
Weak Gal4 drivers can be used to promote expression of potentially lethal ligands. (A) boiNP4065 (top), sggNP4101-Gal4 (middle), and sggNP7270 (bottom) weakly promote expression in terminal filament and cap cells. UAS-GFP-nls (green, weak, left) and UAS-Tau-GFP (green, strong, right) are easily visualized. (B) Hh-GFP expression (green) under control of sggNP4101-Gal4 drives FSC proliferation, resulting in long stalks (arrowheads, Fas3+, red) between developing germ-line cysts (Vasa, blue).
Figure 3
Figure 3
Gal4 expression in IGS cells. (A) ptc-Gal4andsli-Gal4 promote GFP (green) expression in all somatic cells in the anterior half of the germarium, including terminal filament and cap cells, IGS cells, FSCs, and pre-follicle cells. (B) GFP (green) expression in anterior somatic cells of the germarium under control of dlp-Gal4 and one sgg-Gal4 line (sggNP0082). (C and D) fend-Gal4 and en-Gal4 exhibit more restricted GFP (green) expression in IGS cells and FSCs. (E) Broad GFP (green) expression in all somatic cells within the germarium, including terminal filament and cap cells, IGS cells, FSCs, pre-follicle cells, and follicle cells, is observed in 645b-Gal4, 323a-Gal4, and c532-Gal4. Cells in all panels are immunostained with Vasa (blue) to label germ-line cells and Fas3 (red) to label follicle cells. Scale bars are indicated in each panel.
Figure 4
Figure 4
Gal4 expression in late-stage somatic cells. (A) Gal4-independent expression of UAS-GFP (green) is observed in anterior and posterior follicle cells. No GFP expression is observed in the germarium. (B) Many Gal4 lines exhibit only nonspecific UAS-GFP expression (e.g., GMR30H03-Gal4). (C and D) Specific, strong GFP expression is observed in lateral and posterior follicle cells and border cells in (C) GR1-Gal4 and (D) c135-Gal4-Gal4 and c135-Gal4. Gal4-mediated GFP (green) expression is observed in (E) polar cells (bab-Gal4) and (F) stalk cells (185Y-Gal4). Germ-line cells (blue) and follicle cells (Fas3, red) are labeled. Scale bars are indicated.
Figure 5
Figure 5
109-30-Gal4 as a tool for visualizing FSCs. (A) 109-30-Gal4 promotes GFP (green) expression in FSCs and follicle cells up to stage 3. (B) After stage 3, 109-30-Gal4 promotes GFP (green) expression in polar and stalk cells. (C) Single cells at the region 2A–2B border can be labeled using 109-30-Gal4 and the MARCM system. (D) 109-30-Gal4/UAS-GFP-labeled cells (green) produce clonally identical daughter cells. (E) Larval heat shock results in GFP labeling (green) of IGS cells (yellow arrow), FSCs (white arrow), cap cells (pink arrows), and follicle cells (blue arrow). (F) Adult heat shock results in GFP labeling (green) of cells resembling FSCs (low Fas3, red) and generation of GFP-labeled follicle cells. (G) Quantitation of the percent of germaria bearing GFP-labeled IGS cells, FSCs, or follicle cells (fc) in heat-shocked larvae (N = 192) or adults (N = 211). Total numbers of germaria bearing clones in the indicated cell type were scored. IGS cell numbers in larval heat shock vs. adult heat shock are statistically different (P < 0.00001). (H) GFP-labeled FSCs (green, white arrowhead) are located posterior to hh-lacZ–expressing IGS cells (β-Gal, red, yellow arrowhead). hh-lacZ is also expressed in the terminal filament and cap cells (blue arrow). (I) GFP-labeled FSC (green, white arrowhead) is located posterior to ptc-lacZ–expressing IGS cells (β-Gal, red, yellow arrowheads). (J) ptc-lacZ (β-Gal, red) is expressed in IGS cells (yellow arrowheads), FSCs (white arrow), and early follicle cells (blue arrowheads). (K) 109-30-Gal4–labeled cells (CD8-GFP, green) exhibit axon-like projections (arrowhead). (L) GFP-nls–labeled cytoplasm (green) and (M) Tau-GFP (green) are present in projections. Germaria in all panels are labeled with Vasa (blue, germ cells) Fas3 (red, follicle cells), or FC-NA (red, nuclei) and GFP (CD8-GFP, Tau-GFP, or GFP-nls, as indicated, green). White arrowheads indicate the locations of FSCs.
Figure 6
Figure 6
Nutrient deprivation induces a quiescent state in FSCs. (A) FSCs fail to divide in flies raised on fruit juice–only plates (N = 622). Flies fed molasses maintain a constant rate of FSC division (N = 680). (B) 0.5–1% of germaria isolated from flies fed yeast exhibit proliferating FSCs (N = 647). Proliferation rates are 1 day after transfer to fruit juice plates (N = 132), but FSC proliferation arrests at 2 days (N = 168), and quiescence is maintained at 3 days (N = 345), a time point that is used for the experiments described later.
Figure 7
Figure 7
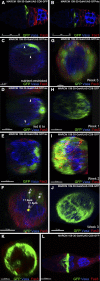
FSCs and their progeny remain at the surface of the germarium during the transition from quiescence to proliferation. (A) Short projections are extended by 109-30-Gal4 MARCM-labeled FSCs (green) in nutrient-restricted flies viewed in two dimensions. (B) Six hours after feeding, labeled FSCs (green) divide, with labeled daughter cells displaced along the germarial surface. (C) Labeled FSC (green) extends projections (arrowheads) around the circumference of the germarium. A cross section of the region 2A–2B border viewed from the anterior in nutrient-restricted flies is shown. (D) Six hours after feeding, FSC (green) projections lengthen (arrowheads), and a daughter cell (green) is displaced along the extended projection. (E) FSCs and daughter cells (green) become positioned around the circumference of the germarium and (F) remain at a constant distance from the central axis of the germarium. Distances between cells A and C from the central axis (B) are shown. (G) Three weeks after feeding, 10–14 labeled cells (green) ring the germarium. 109-30-Gal4–labeled cells (CD8-GFP, green) at the region 2A–2B border (H) 1 week, (I) 2 weeks, and (J) 3 weeks after feeding viewed in cross section from the anterior. (K and L) CD8-GFP–labeled cells ring the germarium and extend projections viewed in cross section (K) or in three dimensions (L). Germaria are labeled with Vasa (blue, germ-line cells), Fas3 (red, follicle cells), and GFP (green).
Figure 8
Figure 8
fend-Gal4 as a tool for analysis of the transition of FSCs from quiescence to proliferation. (A) fend-Gal4–labeled FSCs extend Tau-GFP (green)–containing projections. FSCs are labeled with (B) fend112A-Gal4 or (C) fendNP4124-Gal4 driving UAS-Tau-GFP (green) 1 week after clone induction. (D) FSC clones induced by fendNP4124-Gal4 populate the follicular epithelium after 3 weeks. (E) About 12.5% of germaria bearing fendNP4124-Gal4 FSC clones (white arrowhead) have a marked IGS cell (yellow arrowhead). (F) Quantitation of the numbers of marked IGS cells, FSCs, or follicle cells (fc) in germaria isolated from heat-shocked adults is shown. fendNP4124-Gal4–labeled FSC (green) in (G) nutrient-restricted flies and (H) 6 hr after feeding. (I) Three weeks after feeding, multiple-labeled cells (green) cover half the germarium. (J) Labeled cells (A and C) maintain a constant distance from the central axis of the germarium (large white dot). Germaria are labeled with FC-NA (blue, nuclei), Vasa (blue, germ cells), Fas3 (red, follicle cells), and GFP (green) as indicated.
Figure 9
Figure 9
myospheroid (mys) mutation leads to morphologic and proliferation defects in FSCs. (A–C) 109-30-Gal4–labeled (A) mysM2, (B) mysP9, or (C) mysb13 mutant FSCs (UAS-CD8-GFP, green) at 1 week (top), 2 weeks (middle), and 3 weeks after clone induction (bottom). Fas3 (red) marks follicle cells, and FC-NA (red) marks nuclei. (D) FSC loss over time for WT (Control, blue) and mysP9 mutants (mysP9, red). (E) The percentage of displaced FSCs is shown for WT (Control, blue) and mysP9 mutants (mysP9, red). (F) Proliferation of WT (Control, blue) vs.mysP9 FSCs (mysP9, red) is indicated by the number of germaria containing clones of more than four daughter cells. Statistical differences (P < 0.0001) were observed at 2 and 3 weeks after clone induction. (G) mysP9 mutant projections lack direction, indicated by the percentage of labeled mysP9 mutant (mysP9, red) vs. WT FSCs (Control, blue) extending a projection toward the opposite pole of the germarium. N-values for all panels: WT: week 1 N = 429, week 2 N = 576, week 3 N = 504; mysP9: week 1 N = 437, week 2 N = 537, week 3 N = 448; mysM2: week 1 N = 692, week 2 N = 536, week 3 N = 437); mysb13: week 1 N = 462, week 2 N = 385, week 3 N = 554. ***P < 0.0001. Scale bars are indicated.
Figure 10
Figure 10
myospheroid (mys) is required for the transition from quiescence to proliferation. (A–D) Germaria are labeled with GFP (green), Vasa (blue, germ cells), and Fas3 (red, follicle cells) Scale bars are indicated. (A) In three dimensions, mysP9 mutant FSCs (green) from nutrient-restricted flies extend short projections (arrowheads) similar to those seen in WT cells. (B) Six hours after feeding, mysP9 mutant daughter cells (green) are displaced toward the central axis of the germarium rather than around its circumference. (C) Projections extended by mysP9 mutant cells are short and lack direction. (D) mysP9 mutant cells (A and B, white dots) are located close to the central axis of the germarium (C, white dot). (E) Average projection length 6 hr after feeding from labeled WT (GFP FRT19A, N = 21) or mysP9 mutant (mysP9 FRT19A, N = 26) FSCs. (F) Average volume of projections calculated for WT FSCs (Control, blue, week 1 N = 11, week 2 N = 10, week 3 N = 11) or mysP9 mutant FSCs (mysP9 FRT19A, red, week 1 N = 9, week 2 N = 14, week 3 N = 10). P-values at 2 and 3 weeks after feeding are shown. (G) The distance from the central axis of the germarium of labeled WT (GFP FRT19A, N = 15) or mysP9 mutant (mysP9 FRT19A, N = 38) cells is shown. **P < 0.0002. (H) fend-Gal4 was used to simultaneously label FSCs and reduce βPS levels by expression of RNAi targeting the mys transcript. Distances from the central axis of labeled WT cells (FRT 19A N = 15) or mys knockdown (mys RNAiS00043, N = 34) cells are shown. **P < 0.05. (I–K) Germaria are labeled with GFP (green), Vasa (blue, germ cells), and Fas3 (red, follicle cells). Scale bars are indicated. Projections extending from mysP9-labeled cells (I) 1 week, (J) 2 weeks, and (K) 3 weeks after feeding. (L) Distance from the central axis of fend-Gal4–mediated mysRNAi-expressing FSCs (green).
Figure 11
Figure 11
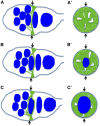
Proposed role for the web of projections in transitioning germ-line cysts from region 2A to region 2B. (A) Prior to contact by a developing germ-line cyst (blue), FSCs and pre-follicle cells ring the germarium (green circles), extending projections that form a weblike barrier (green) at the region 2A–2B border. In a cross section viewed from the anterior (A′), the web appears as a relatively solid surface. (B) Contact between the germ-line cyst in region 2 and the web initiates a series of cellular interactions that promote proliferation of follicle cells and wrapping of the posterior portion of the germ-line cyst. The web is pushed toward the posterior by the germ-line cyst that is now visible in the cross section (B′). (C) As the germ-line cyst exits region 2, proliferation follicle cells wrap the anterior end of the cyst, completing encapsulation. The cyst pushes the web into region 2B and possibly forces the exit of pre-follicle cells at the region 2A–2B border. Arrows indicate the position of FSCs.

References

    1. Assa-Kunik E., Torres I. L., Schejter E. D., Johnston D. S., Shilo B. Z., 2007. Drosophila follicle cells are patterned by multiple levels of Notch signaling and antagonism between the Notch and JAK/STAT pathways. Development 134: 1161–1169. - PubMed
    1. Bolívar J., Pearson J., López-Onieva L., González-Reyes A., 2006. Genetic dissection of a stem cell niche: The case of the Drosophila ovary. Dev. Dyn. 235: 2969–2979. - PubMed
    1. Brand A. H., Perrimon N., 1993. Targeted gene expression as a means of altering cell fates and generating dominant phenotypes. Development 118: 401–415. - PubMed
    1. Cabrera G. R., Godt D., Fang P. Y., Couderc J. L., Laski F. A., 2002. Expression pattern of Gal4 enhancer trap insertions into the bric à brac locus generated by P element replacement. Genesis 34: 62–65. - PubMed
    1. Casanueva M. O., Ferguson E. L., 2004. Germline stem cell number in the Drosophila ovary is regulated by redundant mechanisms that control Dpp signaling. Development 131: 1881–1890. - PubMed

Publication types

LinkOut - more resources