Serial analysis of 38 proteins during the progression of human breast tumor in mice using an antibody colocalization microarray
- PMID: 25680959
- PMCID: PMC4390249
- DOI: 10.1074/mcp.M114.046516
Serial analysis of 38 proteins during the progression of human breast tumor in mice using an antibody colocalization microarray
Abstract
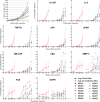
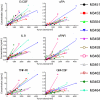
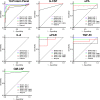
Proteins in serum or plasma hold great potential for use in disease diagnosis and monitoring. However, the correlation between tumor burden and protein biomarker concentration has not been established. Here, using an antibody colocalization microarray, the protein concentration in serum was measured and compared with the size of mammary xenograft tumors in 11 individual mice from the time of injection; seven blood samples were collected from each tumor-bearing mouse as well as control mice on a weekly basis. The profiles of 38 proteins detected in sera from these animals were analyzed by clustering, and we identified 10 proteins with the greatest relative increase in serum concentration that correlated with growth of the primary mammary tumor. To evaluate the diagnosis of cancer based on these proteins using either an absolute threshold (i.e. a concentration cutoff) or self-referenced differential threshold based on the increase in concentration before cell injection, receiver operating characteristic curves were produced for 10 proteins with increased concentration, and the area under curve was calculated for each time point based on a single protein or on a panel of proteins, in each case showing a rapid increase of the area under curve. Next, the sensitivity and specificity of individual and optimal protein panels were calculated, showing high accuracy as early as week 2. These results provide a foundation for studies of tumor growth through measuring serial changes of protein concentration in animal models.
© 2015 by The American Society for Biochemistry and Molecular Biology, Inc.
Figures


Similar articles
-
LGR4 modulates breast cancer initiation, metastasis, and cancer stem cells.FASEB J. 2018 May;32(5):2422-2437. doi: 10.1096/fj.201700897R. Epub 2017 Dec 21. FASEB J. 2018. PMID: 29269400 Free PMC article.
-
A disease annotation study of gene signatures in a breast cancer microarray dataset.Annu Int Conf IEEE Eng Med Biol Soc. 2011;2011:5551-4. doi: 10.1109/IEMBS.2011.6091416. Annu Int Conf IEEE Eng Med Biol Soc. 2011. PMID: 22255596
-
Reelin Deficiency Delays Mammary Tumor Growth and Metastatic Progression.J Mammary Gland Biol Neoplasia. 2017 Mar;22(1):59-69. doi: 10.1007/s10911-017-9373-z. Epub 2017 Jan 26. J Mammary Gland Biol Neoplasia. 2017. PMID: 28124184 Free PMC article.
-
A Comparative Study on the In Vitro Effects of the DNA Methyltransferase Inhibitor 5-Azacytidine (5-AzaC) in Breast/Mammary Cancer of Different Mammalian Species.J Mammary Gland Biol Neoplasia. 2016 Jun;21(1-2):51-66. doi: 10.1007/s10911-016-9350-y. Epub 2016 Mar 22. J Mammary Gland Biol Neoplasia. 2016. PMID: 27002722 Review.
-
Cadherins and the mammary gland.J Cell Biochem. 2005 Jun 1;95(3):488-96. doi: 10.1002/jcb.20419. J Cell Biochem. 2005. PMID: 15838893 Review.
Cited by
-
A versatile snap chip for high-density sub-nanoliter chip-to-chip reagent transfer.Sci Rep. 2015 Jul 7;5:11688. doi: 10.1038/srep11688. Sci Rep. 2015. PMID: 26148566 Free PMC article.
-
Snap Chip for Cross-reactivity-free and Spotter-free Multiplexed Sandwich Immunoassays.J Vis Exp. 2017 Nov 13;(129):56230. doi: 10.3791/56230. J Vis Exp. 2017. PMID: 29155743 Free PMC article.
-
Multicompartment modeling of protein shedding kinetics during vascularized tumor growth.Sci Rep. 2020 Oct 7;10(1):16709. doi: 10.1038/s41598-020-73866-8. Sci Rep. 2020. PMID: 33028917 Free PMC article.
-
An Extracellular Vesicle (EV) Paper Strip for Rapid and Convenient Estimation of EV Concentration.Biosensors (Basel). 2025 May 6;15(5):294. doi: 10.3390/bios15050294. Biosensors (Basel). 2025. PMID: 40422033 Free PMC article.
References
Publication types
MeSH terms
Substances
Grants and funding
LinkOut - more resources
Full Text Sources
Medical
Molecular Biology Databases

