. 2015 Feb 13;4(3):345-54.
doi: 10.1242/bio.201410785.

Transforming Growth Factor β/activin signalling induces epithelial cell flattening during Drosophila oogenesis

Affiliations

Transforming Growth Factor β/activin signalling induces epithelial cell flattening during Drosophila oogenesis

Isabelle Brigaud et al. Biol Open. .

Abstract

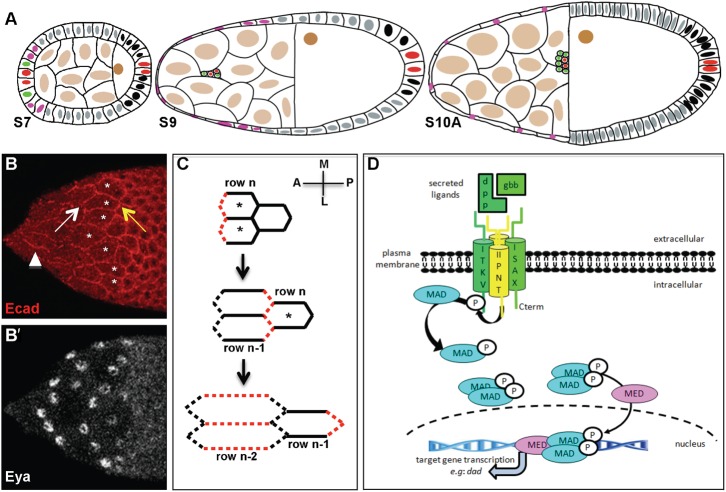
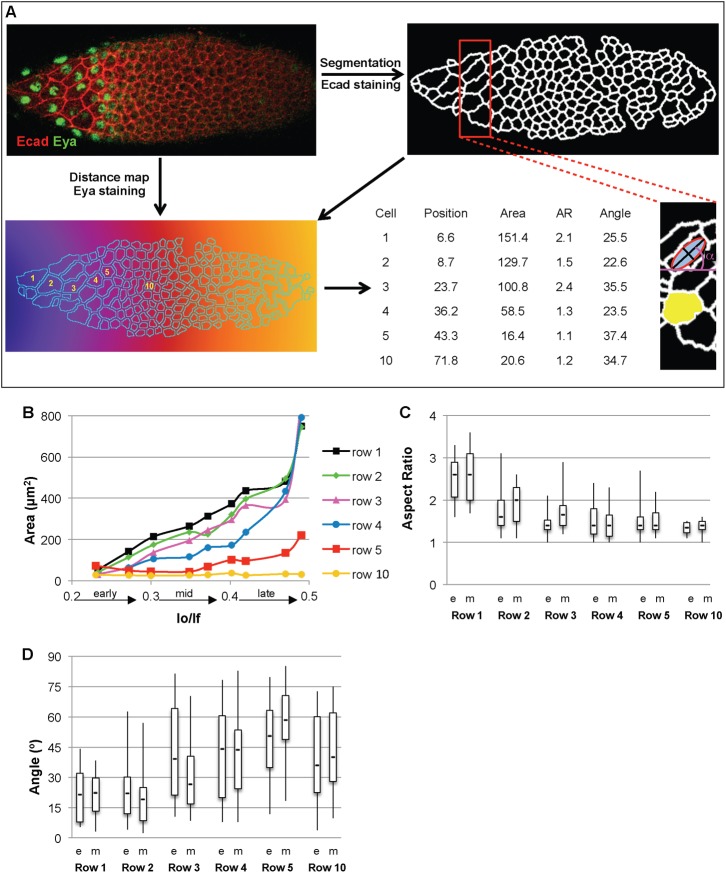
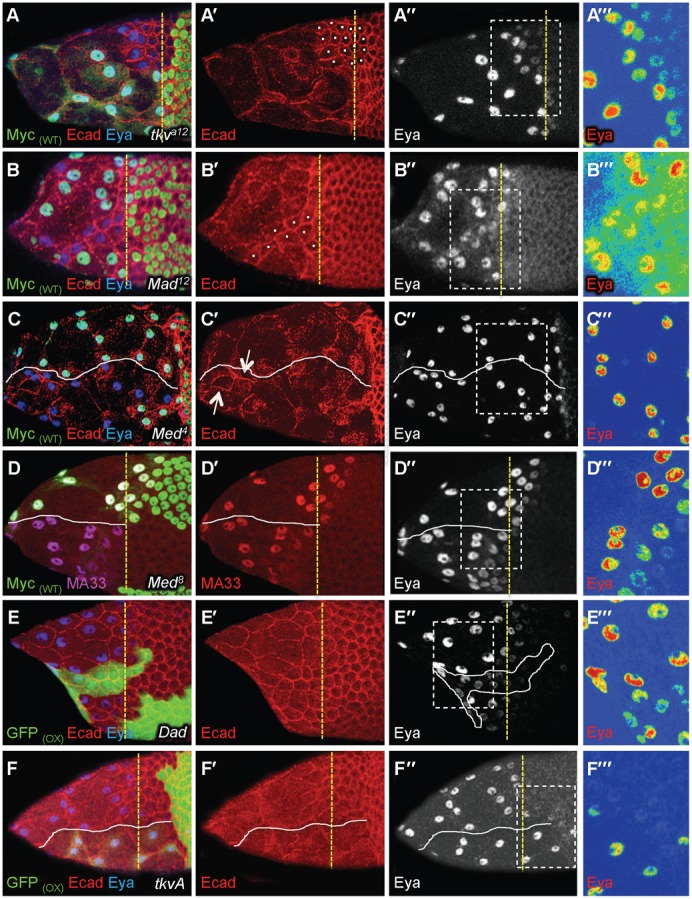
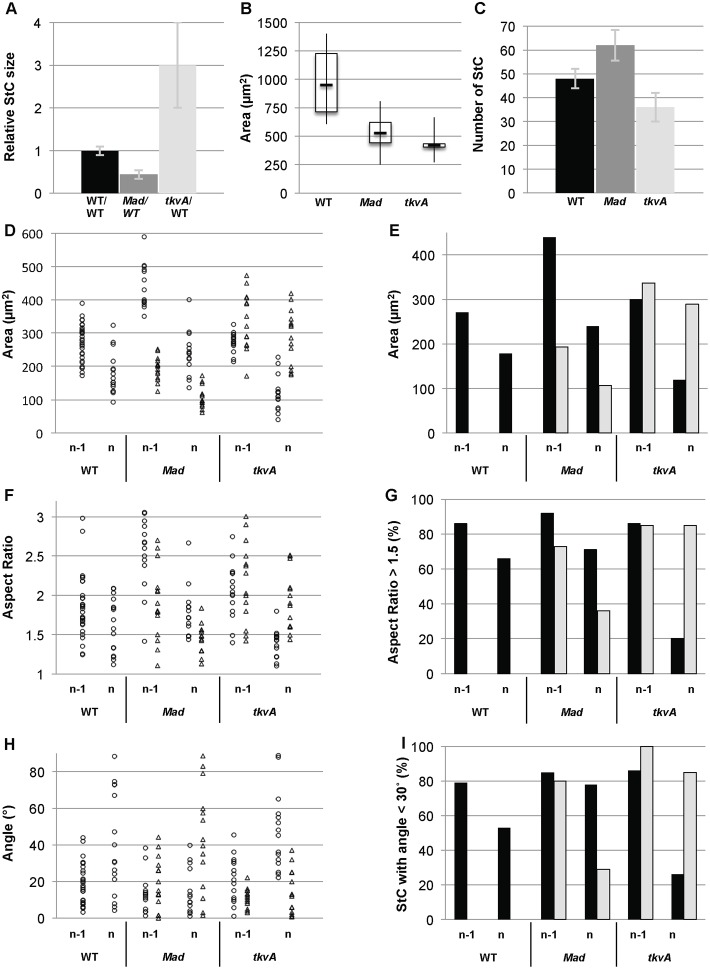
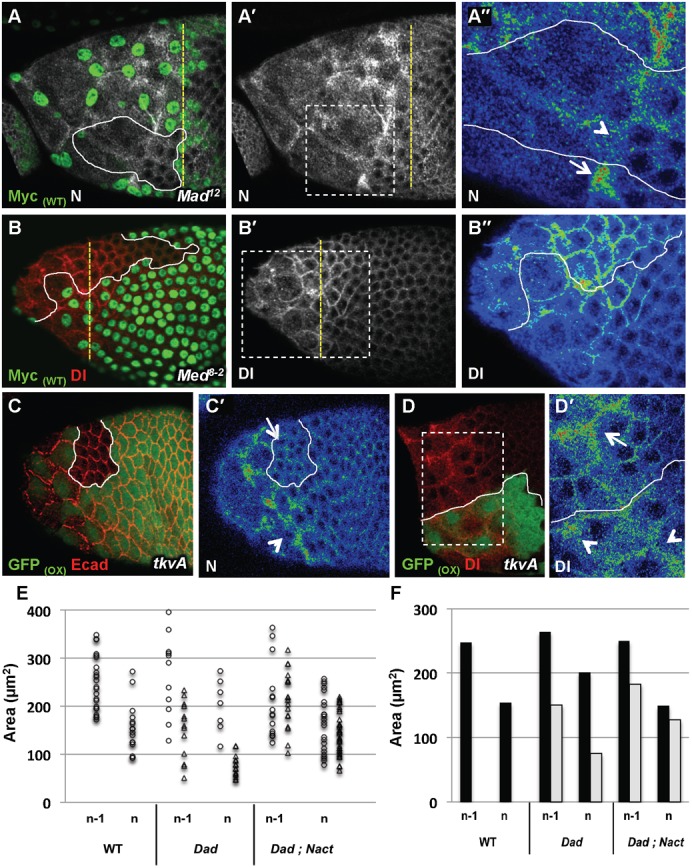
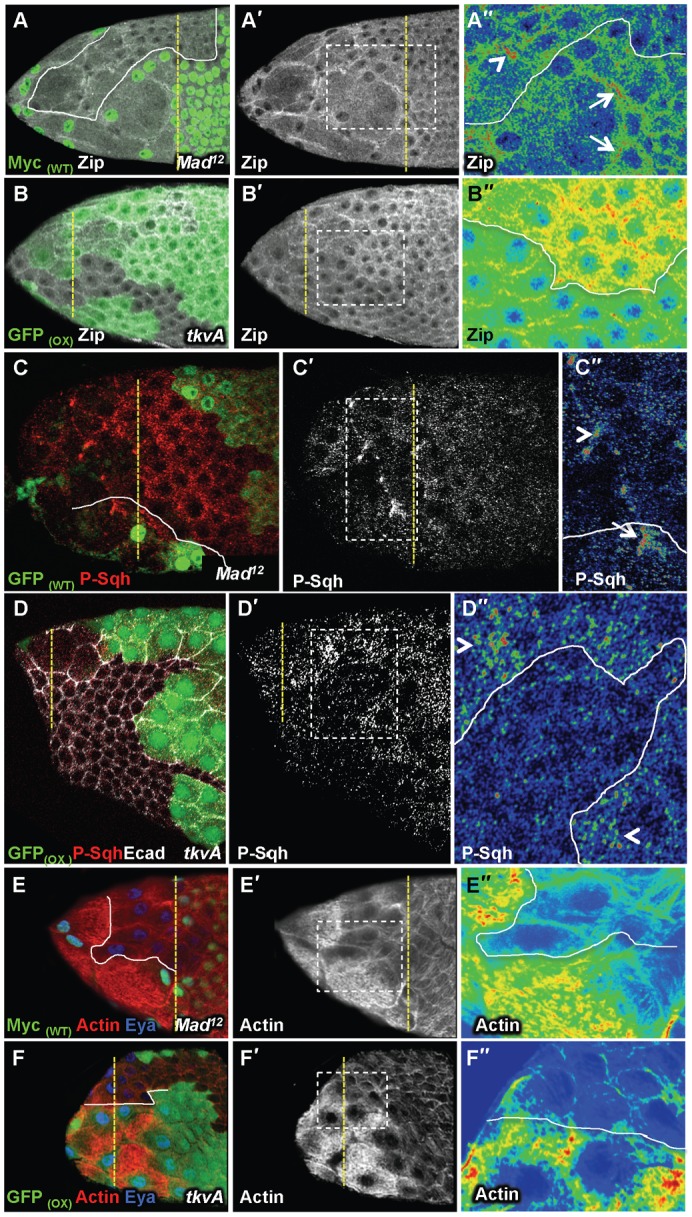
Although the regulation of epithelial morphogenesis is essential for the formation of tissues and organs in multicellular organisms, little is known about how signalling pathways control cell shape changes in space and time. In the Drosophila ovarian epithelium, the transition from a cuboidal to a squamous shape is accompanied by a wave of cell flattening and by the ordered remodelling of E-cadherin-based adherens junctions. We show that activation of the TGFβ pathway is crucial to determine the timing, the degree and the dynamic of cell flattening. Within these cells, TGFβ signalling controls cell-autonomously the formation of Actin filament and the localisation of activated Myosin II, indicating that internal forces are generated and used to remodel AJ and to promote cytoskeleton rearrangement. Our results also reveal that TGFβ signalling controls Notch activity and that its functions are partly executed through Notch. Thus, we demonstrate that the cells that undergo the cuboidal-to-squamous transition produce active cell-shaping mechanisms, rather than passively flattening in response to a global force generated by the growth of the underlying cells. Thus, our work on TGFβ signalling provides new insights into the mechanisms through which signal transduction cascades orchestrate cell shape changes to generate proper organ structure.

Keywords: Adherens junction; Epithelial cell flattening; TGFβ.


Conflict of interest statement

Competing interests: The authors declare no competing or financial interests.

Figures

Fig. 1.
Fig. 1.. Cell flattening during Drosophila oogenesis.
In all figures, anterior is to the left. (A) Schematic of a stage 7 (S7), 9 (S9) and 10A (S10A) follicles. The arrangement and identities of the oocyte (nucleus coloured in brown), nurse cells (light brown), main body follicular cells (grey), polar cells (red), border cells (green), stretched cells (pink) and posterior cells (black) are shown. (B–B′) A mid stage 9 follicle showing adherens junction (AJ) remodelling of the StC. The asterisks indicate flattening StC. Ecad is no longer detected at the three-cell junctions between flattened and flattening StC (white arrow), but is visible at the three-cell junctions between flattening and cuboidal cells (yellow arrow). Ecad is temporally maintained at the A/P oriented junctions (arrowhead). Eya expression is detected in the nuclei of the flattened and flattening StC. (C) Schematic of AJ disassembly in StC during stage 9. AJ of two StC rows are represented at three stages of flattening: row n: flattening StC (asterisks); row n-1: flattened StC; row n-2: fully flattened StC. The AJ that are disassembling are in red. (D) Schematic representation of the TGFβ/BMP signalling pathway in Drosophila. Activation starts with the binding of a homo or heterodimer ligand to a tetrameric complex of two types II and two types I receptors. Under binding, the type II receptor phosphorylates the type I receptor, which in turn activates Mad. Two phosphorylated Mad associate with Med and translocate to the nucleus (Wharton and Derynck, 2009).
Fig. 2.
Fig. 2.. The physical parameters of StC flattening.
(A) The custom-made ImageJ macro uses Ecad staining to segment the cells and Eya staining to extract follicle outlines, to determine the anterior and establish a distance map (for the stack used to describe the macro, see supplementary material macro stack). Six cells are numbered in function of the row they belong to. Apical surface area (Area in µm2), shape (Aspect Ratio), direction of the cell elongation (Angle in °) and position of the cells relative to the anterior (Mean Grey in µm) are given for each cell (see Materials and Methods). The red box in the segmented image is enlarged to show the Area (yellow) of one cell, the position of the best-fitted ellipse (red and grey) in another cell with the axes (black) used to calculate the Aspect Ratio and the Angle (purple). (B) Evolution of the apical surface area (Area) of WT StC per row during the stage 9 and early 10. The rows 1 to 4 contain cells that become StC. The row 5 contains cells that become either StC or main body follicular cells. The row 10 corresponds to a row of cells that become main body follicular cells. The follicles were staged by calculating the ratio between the length of oocyte (lo) and the follicle (lf). Each point represents average of more than 10 areas from 3 to 5 follicles at each lo/lf chosen. (C,D) Box and whisker plots of the shape (Aspect Ratio) (C) and of the direction of the cell elongation (Angle) (D) from WT early (e) and mid (m) follicles. Each sample represents at least 30 cells from 7 to 10 follicles. In all figures with box and whisker plots, boxes extend from to 25th to 75th percentile, with a line at the median. Whiskers extend to the most extreme values.
Fig. 3.
Fig. 3.. TGFβ is required for cuboidal-to-squamous transition.
In all figures, the yellow dotted line marks the A/P position of WT flattening StC and the white line separate the mutant cells from WT cells; the Myc(WT) and GFP(WT) labels indicate that WT cells are green whereas the GFP(OX) label indicates that cells overexpressing a transgene are green; the use of a colour gradient allows the visualization of differences in intensities of protein accumulation from none (blue) to strongest (red); A‴–F‴ are magnified views of the boxes drawn in A″–F″. (A–F‴) Stage 9 (A,B,D–F) or 10 (C) follicles with clones of mutant cells (A–D) or with clones of cells over-expressing Dad (E) or tkvA (F). A‴–F‴ are magnified views of the boxes drawn in A″–F″. (A,B) Difference of dynamic of AJ remodelling between WT StC and mutant StC (white dot) in round or drawn-out clones. Mutant StC undergoing flattening were located three to four rows anterior to WT StC. (C) Follicle with Med clones. The arrows point to persistent AJ within clones. (D) Comparison of MA33 expression between Med and WT StC. (E) Difference of AJ remodelling dynamic between Dad and WT StC (n = 59). (F) Difference of dynamic of the flattening between tkvA and WT StC. In (C–F) a white line separates mutant, Dad or tkvA StC or from WT StC. All the phenotypes have been observed with different alleles of tkv, punt, Mad and Med: for tkv (tkva12: n = 50; tkv8: n = 88, tkv7: n = 42); for punt (puntΔ61: n = 30; punt135: n = 20; punt1046: n = 18), for Mad (Mad1-2: n = 90, Mad12: n = 40, Mad8-2: n = 35), and for Med (Med8: n = 210; Med13: n = 123, Med4: n = 134).
Fig. 4.
Fig. 4.. TGFβ controls the timing, the degree and the dynamic of StC flattening.
Mad follicles refer to follicles containing 40 to 60% of Mad12 or Mad1-2 StC. Note that no measurement has been done on follicles containing 100% of mutant StC, as such follicles die prematurely. tkvA follicles refer to follicles containing more than 50% (A,D–I) or 80% (B,C) of tkvA StC. (A) Relative size of WT, Mad or tkvA StC during flattening. Ratios have been calculated by measuring Area of WT, Mad or tkvA StC located in the same row than WT flattening StC in WT, Mad or tkvA follicles, respectively. Each sample represents at least 28 cells from stage 9 follicles (n = 5) (0.3<lo/lf>0.35). (B) Box and whisker plots of apical surface area (Area) from WT, Mad and tkvA follicles. Each sample represents at least 35 cells from stage 10 follicles (n = 10) (lo/lf = 0,5). (C) Determination of the number of StC in WT (n = 10), Mad (n = 18) or tkvA (n = 22) follicles (lo/lf = 0.5). (D,F,H) Apical surface area (Area), shape (Aspect Ratio) or direction of the cell elongation (Angle) of individual StC is plotted in function of the row: flattening (row n) and flattened (row n-1); and of the genotype: WT (dots), Mad (triangles) or tkvA (triangles). Each sample represents 9 to 14 cells from 4 to 5 follicles (lo/lf = 0.35). (E) Average of apical surface area (Area) of StC per row and genotype: WT (black bar), Mad (grey bar) or tkvA (grey bar). (G) Percentage of StC displaying an Aspect Ratio superior of 1.5, per row and genotype. (I) Percentage of StC elongated in a direction making an angle superior of 30° with the A/P axis, per row and genotype. (E,G,I) Each sample represents 15 to 30 cells from 10 follicles.
Fig. 5.
Fig. 5.. TGFβ controls N and Dl expression patterns.
(A–B″) Stage 9 follicles with clones of Mad or Med cells (A B). A″,B″,D′ are magnified views of the boxes drawn in A′,B′ and D. (A) N expression at AJ undergoing remodelling in Mad (arrowhead) or WT StC (arrow) (n = 10 for Mad and n = 8 for Med). (B) Dl expression in Mad or in WT StC. (n = 8 for Mad and n = 7 for Med) (C,D) Follicles with clones of cells over-expressing tkvA. (C,C′) N expression at the AJ undergoing remodelling of tkvA StC (arrowhead) or of WT cells (arrow) in a stage 8 follicle (n = 23). (D,D′) Dl expression in tkvA StC (arrowhead) or in WT StC (arrow) at stage 9 (n = 19). (E) Apical surface of area (Area) of individual StC is plotted in function of the row: flattening (row n) and flattened (row n-1); and of the genotype: WT (dots), UAS-Dad (triangles) or UAS-Dad; UAS-Nact (triangles). Each sample represents 9 to 14 cells from 3 to 5 follicles (lo/lf = 0.35). (F) Average of apical surface area (Area) of StC per row and genotype: WT (black bar), UAS-Dad (grey bar) or UAS-Dad; UAS-Nact (grey bar). Each sample represents 15 to 30 cells from 10 follicles.
Fig. 6.
Fig. 6.. TGFβ controls Actomyosin network formation and contractibility.
(A–F″) Stage 9 follicles. A″–F″ are magnified views of the boxes drawn in A′–F′. Zip and P-Sqh accumulations and Actin network in Mad (n = 40 for Zip, n = 16 for P-Sqh, n = 40 for Actin) (A,C,E) or tkvA (n = 80 for Zip, n = 22 for P-Sqh and n = 40 for Actin) (B,D,F) follicles. The point at the Anterior AJ of StC undergoing flattening are marked with arrows in WT and with arrowheads in Mad or tkvA clones.

References

    1. Baker R., Schubiger G. (1996). Autonomous and nonautonomous Notch functions for embryonic muscle and epidermis development in Drosophila. Development 122, 617–626. - PubMed
    1. Bangi E., Wharton K. (2006). Dpp and Gbb exhibit different effective ranges in the establishment of the BMP activity gradient critical for Drosophila wing patterning. Dev. Biol. 295, 178–193 10.1016/j.ydbio.2006.03.021 - DOI - PubMed
    1. Bertet C., Sulak L., Lecuit T. (2004). Myosin-dependent junction remodelling controls planar cell intercalation and axis elongation. Nature 429, 667–671 10.1038/nature02590 - DOI - PubMed
    1. Blankenship J. T., Backovic S. T., Sanny J. S., Weitz O., Zallen J. A. (2006). Multicellular rosette formation links planar cell polarity to tissue morphogenesis. Dev. Cell 11, 459–470 10.1016/j.devcel.2006.09.007 - DOI - PubMed
    1. Cordero J. B., Larson D. E., Craig C. R., Hays R., Cagan R. (2007). Dynamic decapentaplegic signaling regulates patterning and adhesion in the Drosophila pupal retina. Development 134, 1861–1871 10.1242/dev.002972 - DOI - PMC - PubMed

LinkOut - more resources