. 2015 Nov;240(11):1452-64.
doi: 10.1177/1535370215570828. Epub 2015 Feb 13.

Antiproliferative activity of long chain acylated esters of quercetin-3-O-glucoside in hepatocellular carcinoma HepG2 cells

Affiliations

Antiproliferative activity of long chain acylated esters of quercetin-3-O-glucoside in hepatocellular carcinoma HepG2 cells

Sudhanshu Sudan et al. Exp Biol Med (Maywood). 2015 Nov.

Abstract

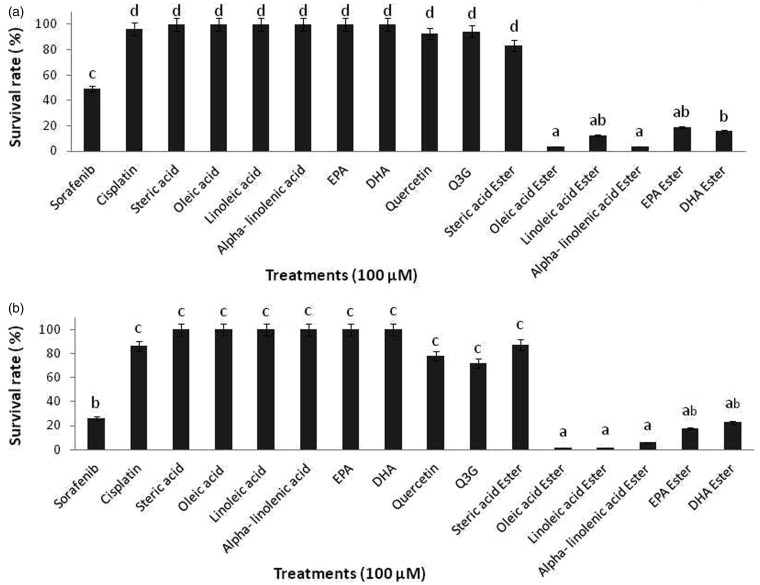
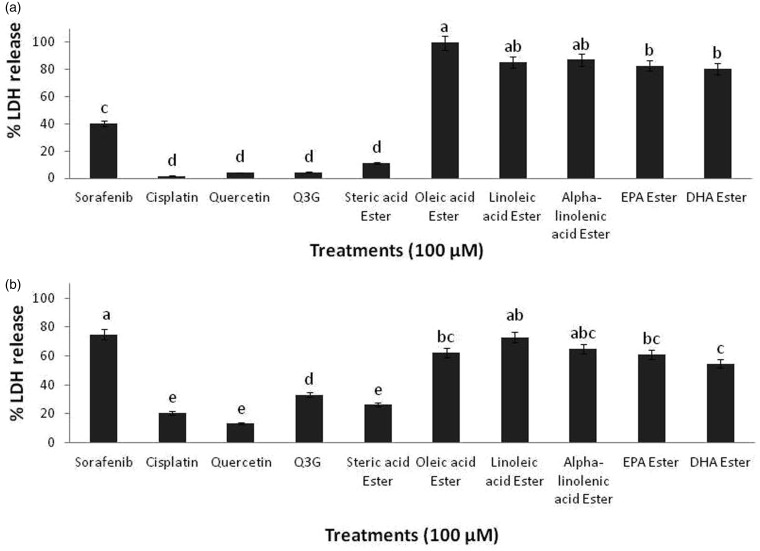
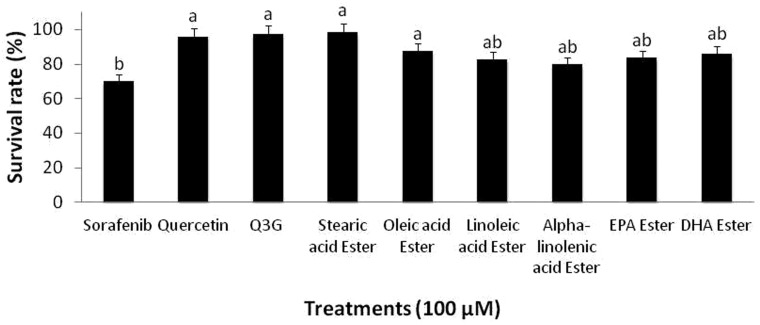
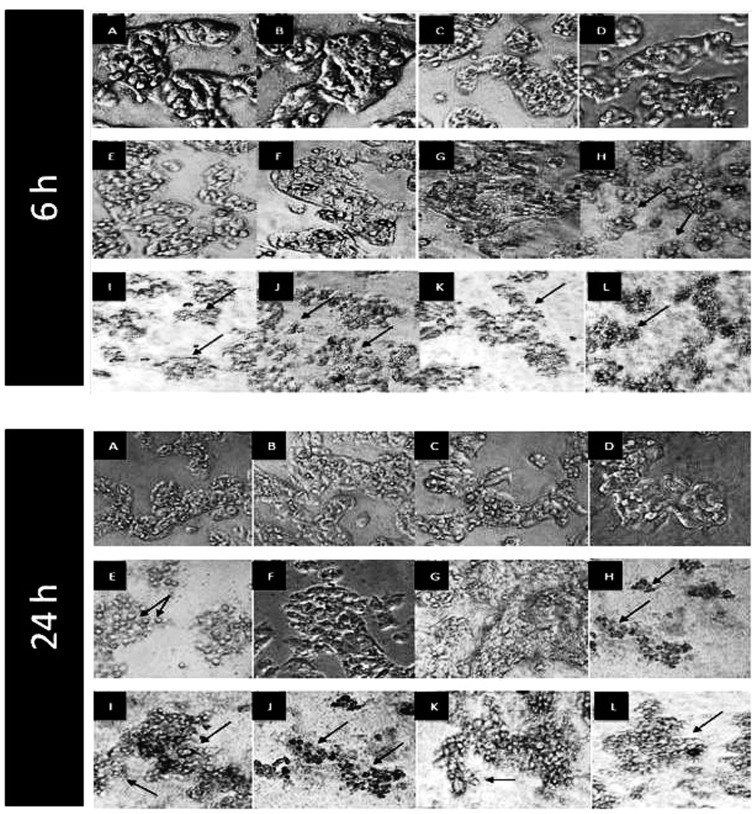
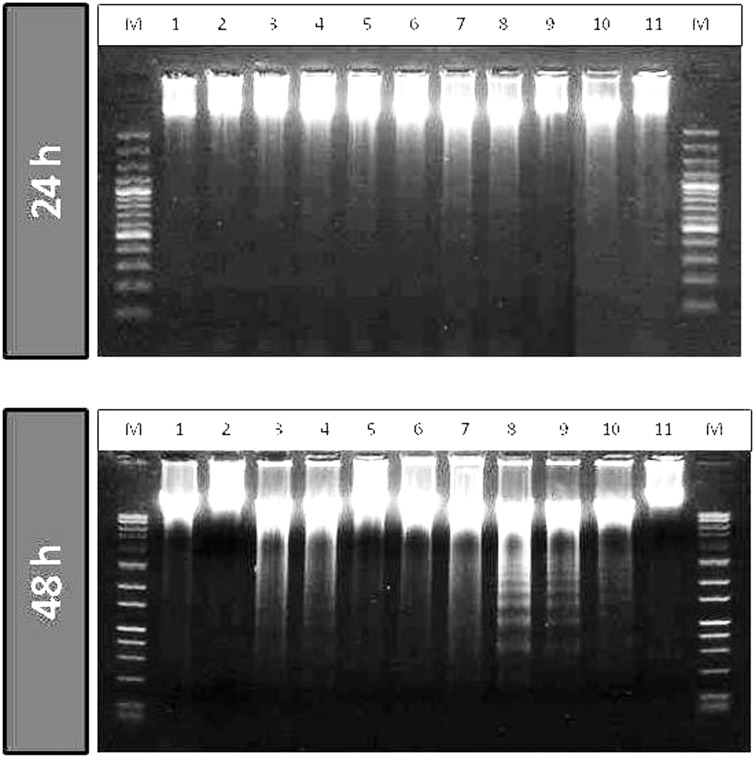
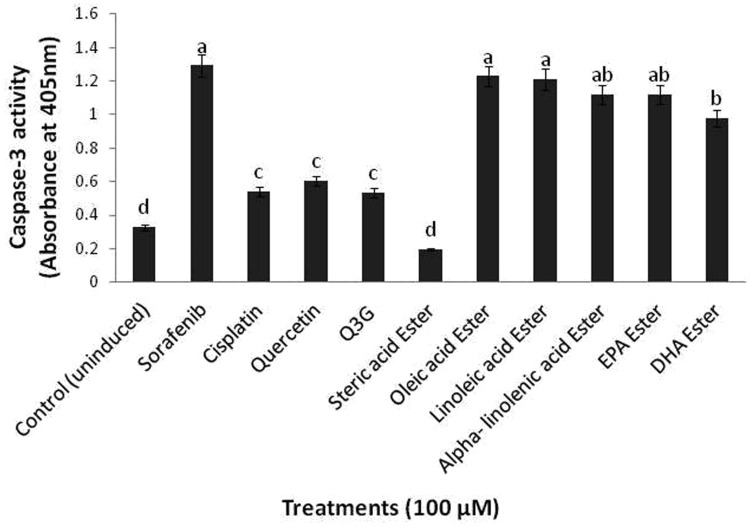
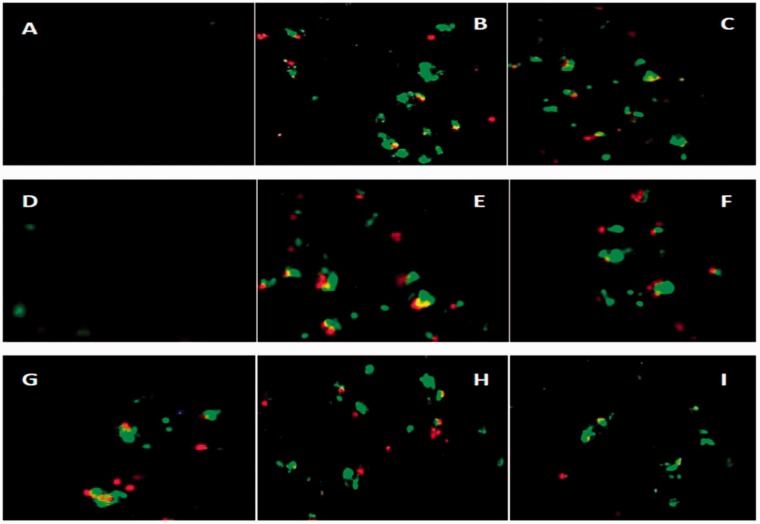
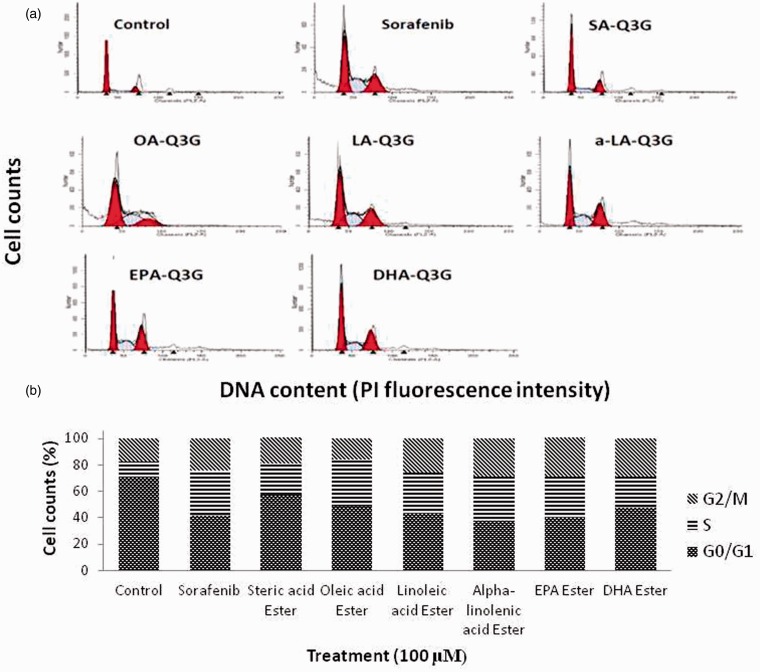
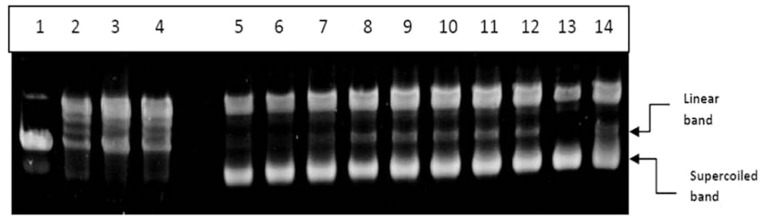
Despite their strong role in human health, poor bioavailability of flavonoids limits their biological effects in vivo. Enzymatically catalyzed acylation of fatty acids to flavonoids is one of the approaches of increasing cellular permeability and hence, biological activities. In this study, six long chain fatty acid esters of quercetin-3-O-glucoside (Q3G) acylated enzymatically and were used for determining their antiproliferative action in hepatocellular carcinoma cells (HepG2) in comparison to precursor compounds and two chemotherapy drugs (Sorafenib and Cisplatin). Fatty acid esters of Q3G showed significant inhibition of HepG2 cell proliferation by 85 to 90% after 6 h and 24 h of treatment, respectively. The cell death due to these novel compounds was associated with cell-cycle arrest in S-phase and apoptosis observed by DNA fragmentation, fluorescent microscopy and elevated caspase-3 activity and strong DNA topoisomerase II inhibition. Interestingly, Q3G esters showed significantly low toxicity to normal liver cells than Sorafenib (P < 0.05), a chemotherapy drug for hepatocellular carcinoma. Among all, oleic acid ester of Q3G displayed the greatest antiproliferation action and a high potential as an anti-cancer therapeutic. Overall, the results of the study suggest strong antiproliferative action of these novel food-derived compounds in treatment of cancer.

Keywords: HepG2 cells; Quercetin-3-O-glucoside; acylation; apoptosis; cancer; caspase-3; cell cycle; chemotherapy; hepatocellular carcinoma; topoisomerase II.


Figures

Figure 1
Figure 1
Antiproliferative effects of long chain fatty acid esters of Q3G on HepG2 cells. The figure describes the percentage of viable HepG2 cells after treatment with long chain fatty acid esters of Q3G. Cells (2 × 104 cells per well; 96-well plate) were treated with 100 µM of test compounds for 6 h (a) and 24 h (b). After treatment viable cell percentage was determined by MTS assay. All long chain fatty acid esters of Q3G except stearic acid ester showed over 85% inhibition of cell proliferation as seen by the cell viability data of 6 h and 24 h. Mean separation between groups was conducted using Tukey's test (n = 6). Significance level was taken at P value < 0.05. Results are expressed relative to control (6 h and 24 h incubation with test compound-free medium)
Figure 2
Figure 2
Cytotoxicity effects of long chain fatty acid esters of Q3G on HepG2 cells. The figure describes the percentage of LDH release from HepG2 cells after treatment with the test compounds. Cells (5 × 103 cells per well; 96-well plate) were treated with 100 µM of the test compounds for 6 h (a) and 24 h (b). After treatment, the cells were centrifuged and the percentage of LDH release from the cells was determined by LDH assay. All long chain fatty acid esters of Q3G except stearic acid ester showed over 80% cell death via LDH release within 6 h of treatment. Mean separation between groups was conducted using Tukey's test (n = 6). Significance level was taken at P value < 0.05
Figure 3
Figure 3
Effect of long chain fatty acid esters of Q3G on viability of normal hepatocytes. Cells (1 × 104 cells per well; 96-well plate) were treated with 100 µM of the test compounds for 24 h. After treatment, viable cell percentage was determined by MTS assay. Results are expressed relative to the control (24 h incubation without test compounds). Mean separation between groups was conducted using Tukey's test (n = 6). Significance level was taken at P value < 0.05
Figure 4
Figure 4
Morphological changes in HepG2 cells after 6 h and 24 h of treatment with long chain fatty acid esters of Q3G. Cells (1 × 104 cells per well; 6-well plate) were treated with 100 µM of test compounds for 6 h and 24 h. After incubation, cells were observed and photographed using Nikon eclipse TS 100 phase contrast microscope equipped with Infinity 1 camera at 10 × magnification. The arrows in the pictures show the change in the morphology of cells upon treatments. As compared to the control, the long chain fatty acid esters of Q3G treated HepG2 cells showed a great decrease in cell number and complete loss of morphology. (a) No treatment control, (b) DMSO control (0.1%), (c) quercetin, (d) Q3G, (e) Sorafenib, (f) Cisplatin, (g) stearic acid ester of Q3G, (h) oleic acid ester of Q3G, (i) linoleic acid ester of Q3G, (j) alpha-linolenic acid ester of Q3G, (k) EPA ester of Q3G, and (l) DHA ester of Q3G
Figure 5
Figure 5
DNA fragmentation in HepG2 cells after 24 h and 48 h of treatment with long chain fatty acid esters of Q3G. Cells (5 × 105 cells; 12-well plate) were treated with 100 µM of the test compounds for 24 h and 48 h. Cells were collected, lysed and DNA was extracted and run on agarose gel containing GelRed™ DNA staining solution for fragmentation analysis. Lane M, DNA marker; lane 1, Cisplatin; lane 2, stearic acid ester of Q3G; lane 3, oleic acid ester of Q3G; lane 4, linoleic acid ester of Q3G; Lane 5, alpha-linolenic acid ester of Q3G; lane 6, EPA ester of Q3G; lane 7, DHA ester of Q3G; lane 8, Q3G; lane 9, quercetin; lane 10, Sorafenib; lane 11, control (no treatment). After 48 h of treatment all long chain fatty acid esters of Q3G except stearic acid ester treatment showed substantial amount of apoptosis as seen by the fragmented DNA pattern
Figure 6
Figure 6
Caspase-3 activation by long chain fatty acid esters of Q3G. Cells (1 × 106 cells/well) were incubated with the test compounds in a six well plate for 24 h. Cells were lysed and protein was quantified. After quantification, 250 µg of protein was used for detection of Caspase-3 activity. Absorbance was taken at 405 nm. The long chain fatty acid esters of Q3G except stearic acid ester of Q3G showed significantly high caspase activity as compared to the parent compounds and the cancer drug Cisplatin (P value < 0.05). Mean separation between groups was conducted using Tukey's test (n = 3). Significance level was taken at P value < 0.05
Figure 7
Figure 7
Apoptosis detection through fluorescence microscopy. Cells were treated for 24 h with 100 μM long chain fatty acid esters of Q3G (d, e, f, g, h, and i) and 100 μM Sorafenib (c) in complete medium. After staining with Annexin V and PI, necrotic and apoptotic cells were detected by fluorescence microscopy (20×). (a) control (no treatment), (b) positive control, (c) Sorafenib, (d) stearic acid ester, (e) oleic acid ester, (f) linoleic acid ester, (g) alpha-linolenic acid ester, (h) EPA ester and (i) DHA ester. (A color version of this figure is available in the online journal.)
Figure 8
Figure 8
Effect of long chain fatty acid esters of Q3G on cell cycle distribution of HepG2 cells. After treatment with 100 μM of the test compounds for 24 h in complete medium, cells were fixed and stained with propidium iodide, and the cell cycle distribution was analyzed by flow cytometry. (a) Representative DNA histograms of the flow cytometric analysis are shown for control and each treatment. (b) The percentage of cells in G1, S, and G2/M phases was calculated and is summarized as a bar graph of the mean values (n = 3). (A color version of this figure is available in the online journal.) SA-Q3G: Stearic acid ester of Q3G; OA-Q3G: Oleic acid ester of Q3G; LA-Q3G: Linoleic acid ester of Q3G; a-LA-Q3G: alpha-linolenic acid ester of Q3G; EPA-Q3G: EPA ester of Q3G; DHA-Q3G: DHA ester of Q3G
Figure 9
Figure 9
DNA topoisomerase II activity. Supercoiled circular pHot1 DNA (0.25 µg) was taken in test and control tubes and incubated with 4 units of the DNA topoisomearse II enzyme. The reactions were kept at 37℃ for 30 min followed by 1% agarose gel run without DNA stain. The gel was stained with GelRed™ DNA staining solution for 2 h and then destained with TBE buffer for 15 to 20 min. The gel was imaged in BioRad Gel doc system. Lane 1, Linear DNA marker; Lane 2, DNA + topo II; Lane 3, VP-16 + DNA + topo II; Lane 4, DMSO control; Lane 5, stearic acid ester + DNA + topoII; Lane 6, oleic acid ester; Lane 7, linoleic acid ester + DNA + topo II; Lane 8, alpha-linolenic acid ester + DNA + topoII; Lane 9, EPA ester + DNA + topoII; Lane 10, DHA ester + DNA + topoII; Lane 11, Q3G + DNA + topo II; Lane 12, quercetin + DNA + topo II; Lane 13, Control (no topo); Lane 14- Sorafenib + DNA + topo II

Similar articles

Cited by

References

    1. Rupasinghe HPV, Nair S, Robinson R. Chemopreventive properties of fruit phenolics and their possible mode of actions. In: Atta-Ur-Rahman (ed.). Studies in natural products chemistry 2014; Vol 42Amsterdam: Elsevier Science Publishers, pp. 229–66.
    1. Arts IC, Hollman PC, De Mesquita HB, Feskens EJ, Kromhout D. Dietary catechins and epithelial cancer incidence: the Zutphen elderly study. Int J Cancer 2001; 92: 298–302. - PubMed
    1. Knekt P, Kumpulainen J, Järvinen R, Rissanen H, Heliövaara M, Reunanen A, Hakulinen T, Aromaa A. Flavonoid intake and risk of chronic diseases. Am J Clin Nutr 2002; 76: 560–8. - PubMed
    1. Le Marchand L, Murphy SP, Hankin JH, Wilkens LR, Kolonel LN. Intake of flavonoids and lung cancer. J Natl Cancer Inst 2000; 92: 154–60. - PubMed
    1. Shen SC, Chen YC, Hsu FL, Lee WR. Differential apoptosis-inducing effect of quercetin and its glycosides in human promyeloleukemic HL-60 cells by alternative activation of the caspase 3 cascade. J Cell Biochem 2003; 89: 1044–55. - PubMed

Publication types

MeSH terms