. 2016 Jul:96:11-25.
doi: 10.1016/j.yjmcc.2015.02.006. Epub 2015 Feb 11.

Dynamics of cross-bridge cycling, ATP hydrolysis, force generation, and deformation in cardiac muscle

Affiliations

Dynamics of cross-bridge cycling, ATP hydrolysis, force generation, and deformation in cardiac muscle

Shivendra G Tewari et al. J Mol Cell Cardiol. 2016 Jul.

Abstract

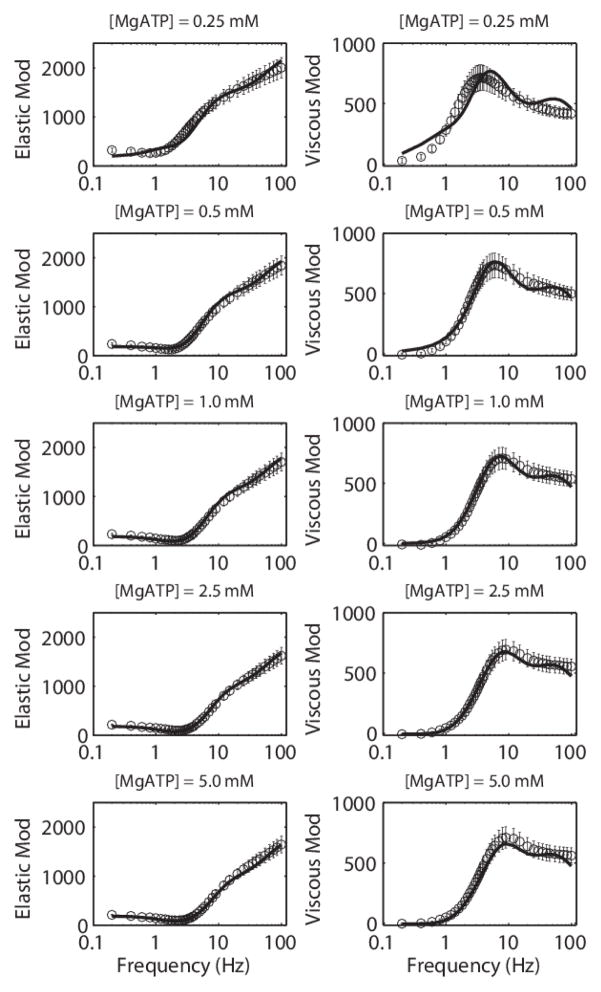
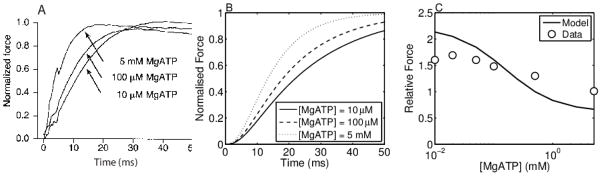
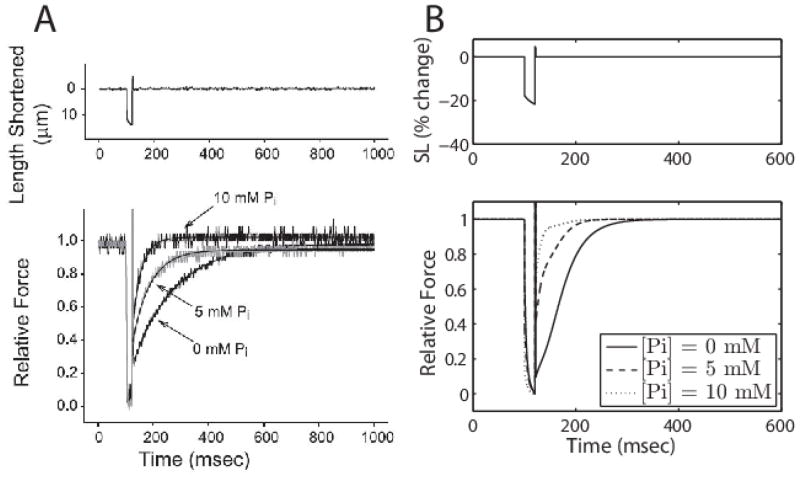
Despite extensive study over the past six decades the coupling of chemical reaction and mechanical processes in muscle dynamics is not well understood. We lack a theoretical description of how chemical processes (metabolite binding, ATP hydrolysis) influence and are influenced by mechanical processes (deformation and force generation). To address this need, a mathematical model of the muscle cross-bridge (XB) cycle based on Huxley's sliding filament theory is developed that explicitly accounts for the chemical transformation events and the influence of strain on state transitions. The model is identified based on elastic and viscous moduli data from mouse and rat myocardial strips over a range of perturbation frequencies, and MgATP and inorganic phosphate (Pi) concentrations. Simulations of the identified model reproduce the observed effects of MgATP and MgADP on the rate of force development. Furthermore, simulations reveal that the rate of force re-development measured in slack-restretch experiments is not directly proportional to the rate of XB cycling. For these experiments, the model predicts that the observed increase in the rate of force generation with increased Pi concentration is due to inhibition of cycle turnover by Pi. Finally, the model captures the observed phenomena of force yielding suggesting that it is a result of rapid detachment of stretched attached myosin heads.

Keywords: Cardiac muscle; Cross-bridge cycle; Force generation; Metabolites; Sinusoidal perturbation analysis; Viscoelasticity.


Figures

Figure A1
Figure A1
Comparison of numerical simulations of distributed PDE model and ODE system for moments. A. Simulated time courses of fraction in each state for the distributed model. B. Mean strain of each attached state for the distributed model. C. Simulated time courses of fraction in each state for (0-order moments) for the ODE approximation. Mean strain of each attached state for the ODE approximation. Initial conditions and definitions are provided in the text. Metabolite concentrations are: [MgATP] = 5 mM; [MgADP] = 0 mM; [Pi] = 0 mM and temperature is 17 °C. Parameters used for simulations are as listed in Table 1 for rat.
Figure B1
Figure B1
Effect of [MgATP], [MgADP] and [Pi] on absolute isometric force and rate of force development. A. Absolute isometric force relative to peak isometric force at [MgATP] = 0.25 mM. B. Rate of force development at three different [MgATP]. Force is normalized using maximum and minimum at each [MgATP]. For both A and B, [MgADP] = 0 mM, [Pi] = 0 mM and temperature is 17 °C. C. Absolute isometric force relative to peak isometric force at [MgADP] = 0.25 mM. D. Rate of force development at three different [MgADP]. Force is normalized using maximum and minimum at each [MgADP]. For both C and D, [MgATP] = 1 mM, [Pi] = 0 mM and temperature is 17 °C. E. Absolute isometric force relative to peak isometric force at [Pi] = 0 mM. F. Rate of force development at three different [Pi]. Force is normalized using maximum and minimum at each [Pi]. [MgATP] = 5 mM, [MgADP] = 0 mM and temperature is 17 °C. Parameters used for simulations are as listed in Table 1 for rat.
Figure D1
Figure D1
Force yielding during muscle lengthening (computational) experiment. A) Muscle lengthening protocol begins at 200 msec and continues for 300 msec after which the lengthening is stopped (at 500 msec). B) Steady-state force before 200 msec (solid vertical line) reflects the maximum isometric force. After 200 msec there is a sudden increase in force in response to lengthening of the sarcomere, however there is a sudden drop seen after few msec (dashed vertical line) indicative of the force yielding process. The drop in force continues till a new steady-state of strongly bound post-ratcheted XBs is reached (vertical dashed line). Soon after the force starts to increase till lengthening is stopped (at 500 msec). Soon after the lengthening is stopped there is a drop in force due to a drop in mean strain (D) seen after 500 msec. During this drop in strain the XBs continue to cycle to reach isometric force set by the new muscle length. Model parameters used for simulation are listed in Table 1 under rat column. Temperature is set to 17 °C and metabolites are: [MgATP] = 5 mM, [MgADP] = 0 mM, and [Pi] = 0.25 mM.
Figure E1
Figure E1
Model fits to remainder of elastic and viscous moduli data from mouse cardiac muscle experiments and model fittings not shown in Figure 3.
Figure 1
Figure 1
A) The proposed model of cross-bridge (XB) cycling. N is a non-permissible XB state where myosin heads cannot bind with actin (as in the absence of cytosolic Ca2+), P is a permissible XB state during which myosin heads can bind with actin molecules (i.e. when cytosolic Ca2+ is present, represented by black dot), A1T is a loosely attached XB state (with [MgADP] bound). Pi, bound with A1 sub-state from the previous XB cycle, rapidly dissociates to form A1′ (shown with the attached dotted box); Pi binding/release step is assumed to be in rapid-equilibrium and has a dissociation constant KPi. A2 is a strongly bound (pre-ratcheted or pre-powerstroke) XB state. A3T is a strongly bound (post-ratcheted or post-powerstroke) XB state. It is assumed that the release of MgADP and binding of MgATP is in rapid-equilibrium (shown with the dotted box attached with A3T) and occurs after the force generation step (power-stroke); dissociation constants of MgADP and MgATP are represented by KMgADP and KMgATP, respectively. B) Proposed mechanism of force generation in cardiac muscle. FXB is the force generated due to XBs undergoing cycling and stretching. Springs (k1 and k2) and dashpot (η) in parallel represent the passive cardiac muscle force response, which is independent of the XBs and dominates at very low and high frequencies. Fload represents the afterload against which the muscle contracts during sarcomere (computational) shortening experiments.
Figure 2
Figure 2
Frequency response of rat cardiac muscle. Measured elastic and viscous moduli are plotted as functions of frequency as open circles (with error bars; n = 8). Solid lines are model fits to data obtained at [MgATP] = 0.25–5 mM. With increasing [MgATP] there is an increase in the ‘dip’ observed in elastic modulus between 1 – 8 Hz which is accurately captured by the computational model. Likewise, there is shift (towards the right side) in the peak viscous modulus with increasing [MgATP] that the computational model captures reasonably well.
Figure 3
Figure 3
Frequency response of mouse cardiac muscle. Measured elastic and viscous moduli are plotted as functions of frequency as open circles. Model fits to data are obtained with different [MgATP] (= 0.4, 0.6, 0.8, 1, 2, 5 mM; n = 12) and [Pi] (= 0, 0.4, 0.8, 1.25, 1.8, 2.4, 3, 3.5, 4 mM; n = 5). For clarity fits to data for [MgATP] = 0.4, 1.0 and 5 mM (A) and [Pi] = 0, 1.8 and 4 mM (B) are shown here. Model fits to all other experimental data are shown in Appendix E.
Figure 4
Figure 4
Force-velocity relationship in mouse cardiac muscle. A) Open circles are force-velocity data from Palmer, Schmitt [31] for control mouse myocardial strips. Solid line represents model simulations reproducing the experiments. Model based force-velocity data are computed by performing (computational) sarcomere quick-release experiments by holding the (virtual) sarcomere constant at a fixed length (2.2 μm) till maximum isometric tension (Tmax) is developed and velocity was computed from the slope of percent SL change after ~45 millisecond (msec) of release. After release the sarcomere was made to contract against different loads (T) less than equal to Tmax. For simulating the sarcomere release experiments the parallel linear spring is replaced by a non-linear spring as described by [19] and force due to this spring is set to be β·kPE,2, where β is a scaling factor chosen such that simulated unloaded shortening velocity matches experimentally reported value. (Details of passive force formulation are given in Appendix C.) For all the (computational) experiments, force due to this Rice-type spring is β·kPE,2. All other parameters are as reported in Table 1 for mouse. B) Normalized power is the product of (T/Tmax) × Velocity (L·s−1).
Figure 5
Figure 5
Temperature dependence of myocardial mechanics. Data are from mouse myocardial strip undergoing sinusoid length perturbation experiments at 17 °C (A) and 37 °C (B). Open circles are experiments data and solid lines are model fits. Force generation parameters were optimized to explain the data obtained at 17 °C; all parameters associated with XB cycling were kept fixed. A total of 6 Q10 parameters are identified to explain data obtained at 37 °C. Notice the shift of characteristic ‘dip’ in elastic modulus towards higher frequencies with increase in temperature (17 °C: 8 Hz; 37 °C: 20 Hz), which the model captures accurately. The model is also exhibits the negative viscous modulus seen at 37 °C. The force generation parameters estimated for the data at 17 °C are: kstiff,1 = 1423.3 mN mm−2 μm−1, kstiff,2 = 26348 mN mm−2 μm−1, kPE,2 = 1256.6 mN mm−2 μm−1, η = 0.86 mN sec mm−2 μm−1, kPE,1 = 222.3 mN mm−2 μm−1.
Figure 6
Figure 6
A. Representative sarcomere quick-release (computational) experiment with constant afterload. Increasing value of afterload decreases the amount sarcomere can contract. The arrow signifies time-point around which slopes were computed and an average of those slopes is reported as the shortening velocity (B). Velocity is computed after the end of ‘yielding’ process (slight increase in sarcomere length visible before the arrow). B. Model predicted increase in sarcomere shortening velocity with increasing temperature. Metabolite concentrations are: [MgATP] = 5 mM, [MgADP] = 36 μM, [Pi] = 0.25 mM. Metabolites conditions are same for all temperatures.
Figure 7
Figure 7
Effect of ATP and ADP on shortening velocity. Filament velocity data from Yamashita, Sata [47] obtained in the absence MgADP (closed circles) and presence of MgADP (closed squares) is compared with model predictions (open circles and open squares). To perform these predictions, sarcomere release computational experiments were performed using the muscle model with mouse parameters shown in Table 1. The (virtual) sarcomere is held constant at a length of 2.2 μm and released after 100 msec to contract against no load with different [MgATP]. Shortening velocity is computed by taking an average of the sarcomere slope between 30–50 msec of release. KMgADP is kept fixed at the value reported by Yamashita, Sata [47].
Figure 8
Figure 8
Effect of ATP on force development. A. Experimentally observed rate of isometric force development at different [MgATP], from Ebus, Papp [51]. B. Model-predicted rate of isometric force development at different [MgATP]. C. Experimentally measured changes in maximum isometric force (open circles) as a function of [MgATP] with [MgATP] = 10 μM, 100 μM, and 5 mM. Data are normalized to maximum isometric force at [MgATP] = 5 mM). Model predicted changes in maximum isometric force under the same conditions (solid line). Simulations use parameter values listed in Table 1 for mouse and metabolite concentrations [MgADP] = 0 mM, [Pi] = 0 mM and temperature 20 °C, to match the experimental conditions. Figure in panel A reproduced from Ebus, Papp [51] (pending permission).
Figure 9
Figure 9
Model predicted changes to peak isometric force and rate of force development at different [MgADP]. Simulation conditions are [MgATP] = 1 mM, [Pi] = 0 mM, and temperature 30 °C. A. Model suggests an increase in isometric force with increasing [MgADP], similar to experimental observations [52]. Force is normalized to peak isometric force at [MgADP] = 0.25 mM. B. Rate of isometric force development with increasing [MgADP]. The rate of force development decreases with increasing [MgADP], similar to experimental observations of Lu, Moss [53].
Figure 10
Figure 10
A. Model predicted decrease in peak isometric force with increasing [Pi]. Force is normalized for the maximum isometric force at [Pi] = 25 μM. Other metabolite concentrations: [MgATP] = 5 mM, [MgADP] = 0 mM, and temperature 30 °C. B. Model predicts a decrease in rate of force generation with increasing [Pi]. Metabolite concentrations and temperature are same as A. C. Model predicts a reduction in sarcomere shortening velocity with increase in [Pi] (solid line: 0 mM [Pi]; broken line: 20 mM [Pi]). The method for computing shortening velocity is as in Figure 7B. [MgADP] = 0 mM, [MgATP] as shown in the figure.
Figure 11
Figure 11
Effect of Pi on rate of force development. A. Slack-restretch maneuver reproduced from Hinken and McDonald [27] (pending permission). B. Simulated slack-restretch experiment. Following the slack-restretch experimental protocol [71], SL is initially held fixed at length of 2.2 μm (Lo). At time 100 msec Lo is reduced by 15% and allowed to shorten for 20 msec; afterwards muscle is re-stretched to 105% of Lo for 2 msec and then returned to Lo. Metabolites concentrations: [MgATP] = 4 mM, [MgADP] = 0 mM; temperature is 13 °C.

References

    1. Szent-Gyorgyi AG. The role of actin-myosin interaction in contraction. Symposia of the Society for Experimental Biology. 1968;22:17–42. - PubMed
    1. Huxley AF. Muscle structure and theories of contraction. Progress in biophysics and biophysical chemistry. 1957;7:255–318. - PubMed
    1. Huxley AF, Simmons RM. Proposed mechanism of force generation in striated muscle. Nature. 1971;233:533–8. - PubMed
    1. Cooke R. The mechanism of muscle contraction. CRC critical reviews in biochemistry. 1986;21:53–118. - PubMed
    1. Cooke R. Actomyosin interaction in striated muscle. Physiological reviews. 1997;77:671–97. - PubMed

Publication types

Substances