

A new positive relationship between pCO2 and stomatal frequency in Quercus guyavifolia (Fagaceae): a potential proxy for palaeo-CO2 levels
- PMID: 25681824
- PMCID: PMC4373289
- DOI: 10.1093/aob/mcv007
A new positive relationship between pCO2 and stomatal frequency in Quercus guyavifolia (Fagaceae): a potential proxy for palaeo-CO2 levels
Abstract
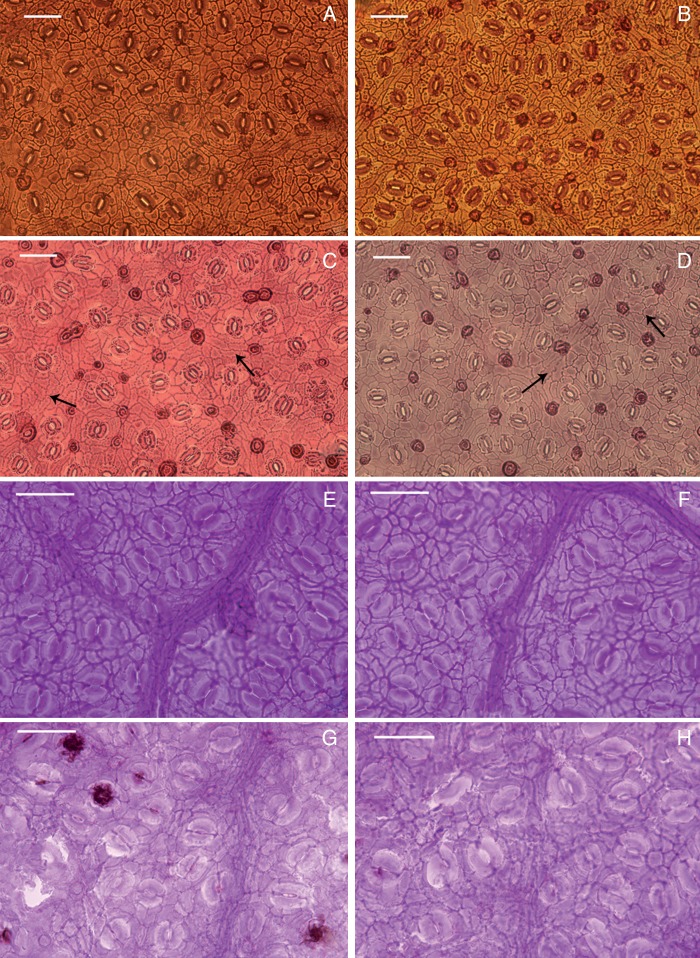
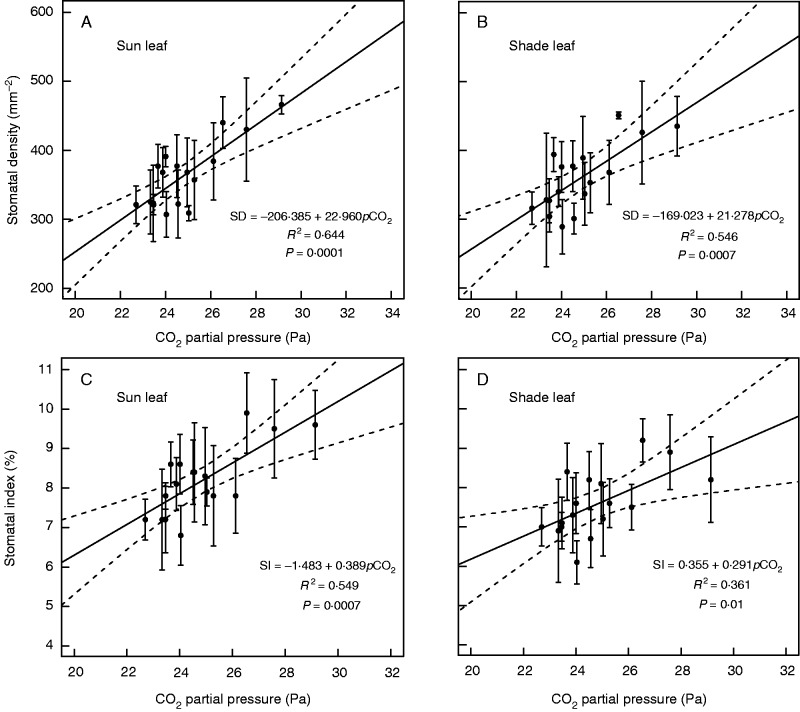
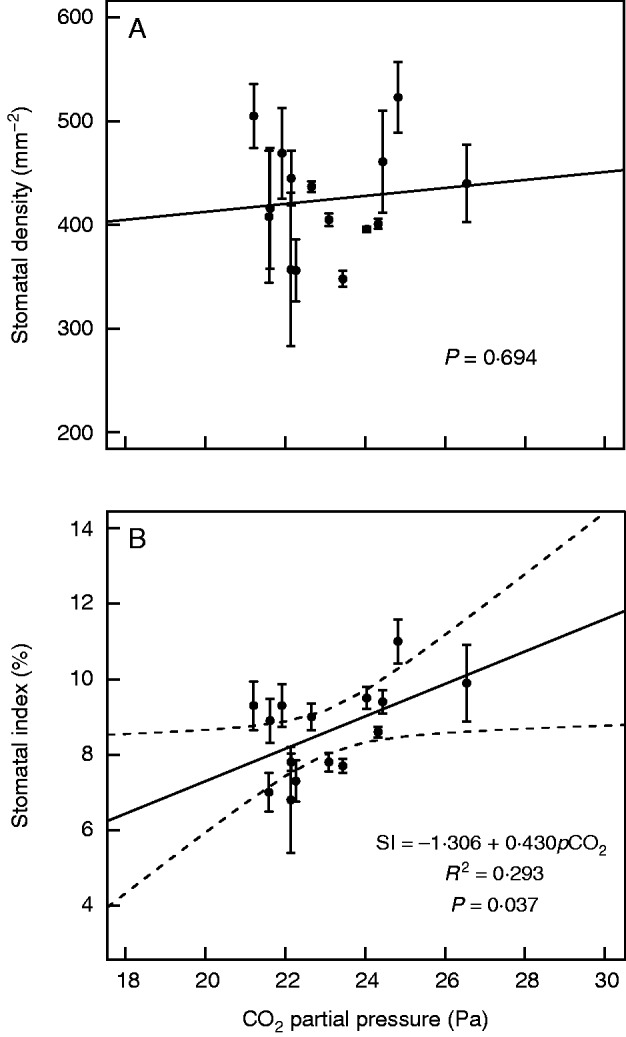
Background and aims: The inverse relationship between atmospheric CO2 partial pressure (pCO2) and stomatal frequency in many species of plants has been widely used to estimate palaeoatmospheric CO2 (palaeo-CO2) levels; however, the results obtained have been quite variable. This study attempts to find a potential new proxy for palaeo-CO2 levels by analysing stomatal frequency in Quercus guyavifolia (Q. guajavifolia, Fagaceae), an extant dominant species of sclerophyllous forests in the Himalayas with abundant fossil relatives.
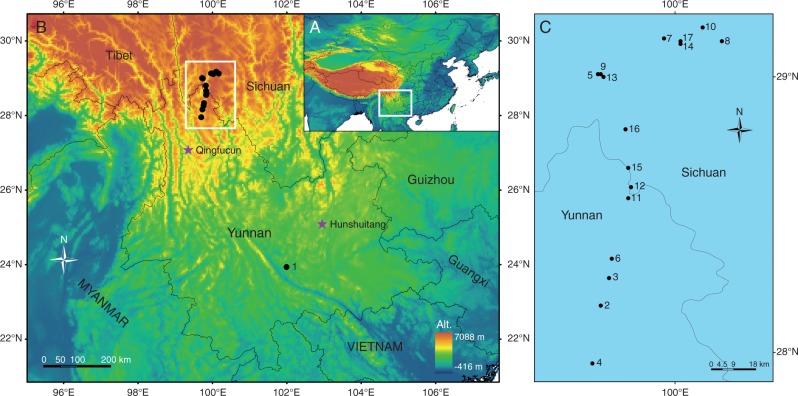
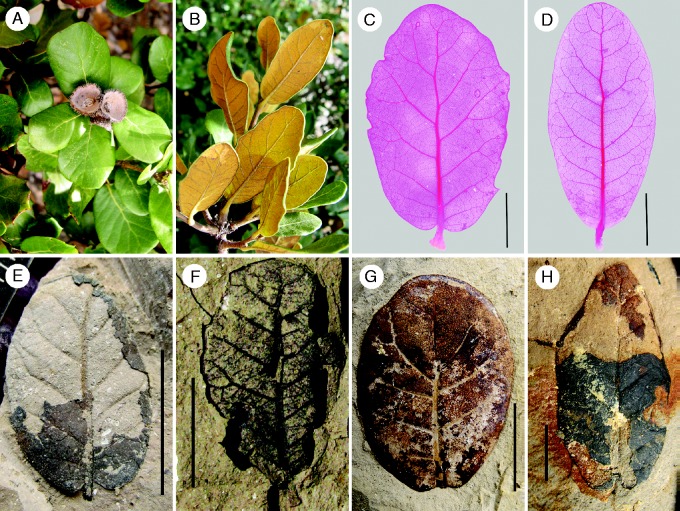
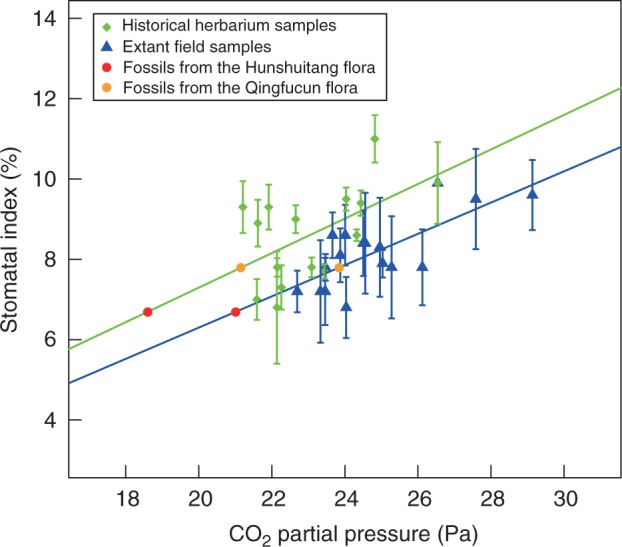
Methods: Stomatal frequency was analysed for extant samples of Q. guyavifolia collected from17 field sites at altitudes ranging between 2493 and 4497 m. Herbarium specimens collected between 1926 and 2011 were also examined. Correlations of pCO2-stomatal frequency were determined using samples from both sources, and these were then applied to Q. preguyavaefolia fossils in order to estimate palaeo-CO2 concentrations for two late-Pliocene floras in south-western China.
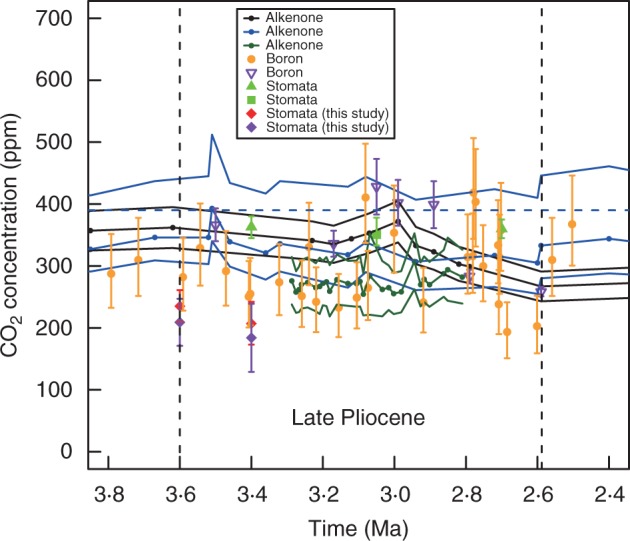
Key results: In contrast to the negative correlations detected for most other species that have been studied, a positive correlation between pCO2 and stomatal frequency was determined in Q. guyavifolia sampled from both extant field collections and historical herbarium specimens. Palaeo-CO2 concentrations were estimated to be approx. 180-240 ppm in the late Pliocene, which is consistent with most other previous estimates.
Conclusions: A new positive relationship between pCO2 and stomatal frequency in Q. guyavifolia is presented, which can be applied to the fossils closely related to this species that are widely distributed in the late-Cenozoic strata in order to estimate palaeo-CO2 concentrations. The results show that it is valid to use a positive relationship to estimate palaeo-CO2 concentrations, and the study adds to the variety of stomatal density/index relationships that available for estimating pCO2. The physiological mechanisms underlying this positive response are unclear, however, and require further research.
Keywords: Q. guajavifolia; Quercus guyavifolia; Stomatal density; altitudinal gradient; atmospheric CO2 concentration; climate change; historical specimen; oak; palaeo-CO2 reconstruction; stomatal index.
© The Author 2015. Published by Oxford University Press on behalf of the Annals of Botany Company. All rights reserved. For Permissions, please email: journals.permissions@oup.com.
Figures
References
-
- Atkinson CJ, Taylor JM, Wilkins D, Besford RT. 1997. Effects of elevated CO2 on chloroplast components, gas exchange and growth of oak and cherry. Tree Physiology 17: 319–325. - PubMed
-
- Badger MPS, Schmidt DN, Mackensen A, Pancost RD. 2013. High-resolution alkenone palaeobarometry indicates relatively stable pCO2 during the Pliocene (3·3–2·8 Ma). Philosophical Transactions of the Royal Society A: Mathematical Physical and Engineering Sciences 371: 20130094. - PubMed
-
- Bai YJ, Chen LQ, Ranhotra PS, Wang Q, Wang YF, Li CS. 2015. Reconstructing atmospheric CO2 during the Plio-Pleistocene transition by fossil Typha. Global Change Biology 21: 874–881. - PubMed
-
- Bartoli G, Hönisch B, Zeebe RE. 2011. Atmospheric CO2 decline during the Pliocene intensification of Northern Hemisphere glaciations. Paleoceanography 26: PA4213.
-
- Beerling DJ, Chaloner WG. 1993. Evolutionary responses of stomatal density to global CO2 change. Biological Journal of the Linnean Society 48:343–353.
Publication types
MeSH terms
Substances
LinkOut - more resources
Full Text Sources
Other Literature Sources
