

Solid-state NMR and membrane proteins
- PMID: 25681966
- PMCID: PMC4372479
- DOI: 10.1016/j.jmr.2014.11.015
Solid-state NMR and membrane proteins
Abstract
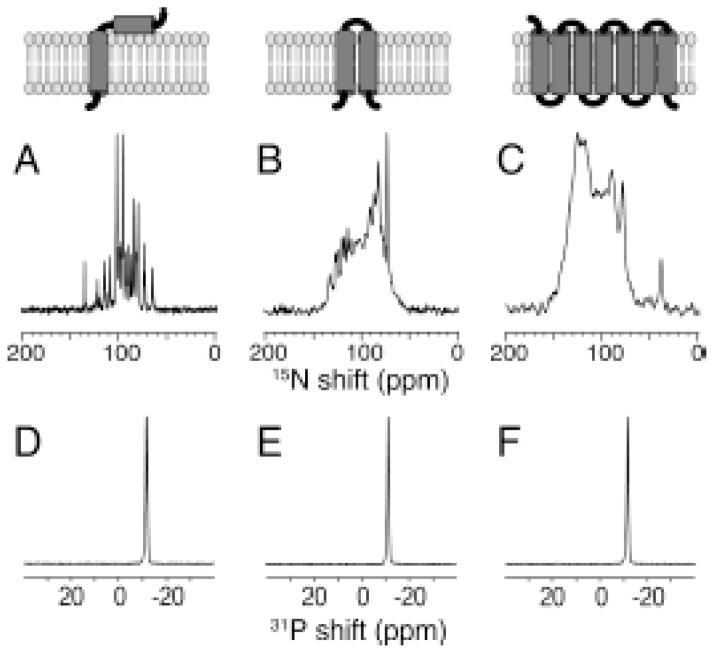
The native environment for a membrane protein is a phospholipid bilayer. Because the protein is immobilized on NMR timescales by the interactions within a bilayer membrane, solid-state NMR methods are essential to obtain high-resolution spectra. Approaches have been developed for both unoriented and oriented samples, however, they all rest on the foundation of the most fundamental aspects of solid-state NMR, and the chemical shift and homo- and hetero-nuclear dipole-dipole interactions. Solid-state NMR has advanced sufficiently to enable the structures of membrane proteins to be determined under near-native conditions in phospholipid bilayers.
Keywords: Bilayers; Chemical shift anisotropy; Dipolar coupling; Magic angle spinning; Phospholipids; Structure determination.
Copyright © 2014 Elsevier Inc. All rights reserved.
Figures
Similar articles
-
Solid-state NMR structures of integral membrane proteins.Mol Membr Biol. 2015 Aug-Dec;32(5-8):156-78. doi: 10.3109/09687688.2016.1139754. Epub 2016 Feb 8. Mol Membr Biol. 2015. PMID: 26857803 Review.
-
Complete resolution of the solid-state NMR spectrum of a uniformly 15N-labeled membrane protein in phospholipid bilayers.Proc Natl Acad Sci U S A. 1997 Aug 5;94(16):8551-6. doi: 10.1073/pnas.94.16.8551. Proc Natl Acad Sci U S A. 1997. PMID: 9238014 Free PMC article.
-
Mechanically, magnetically, and "rotationally aligned" membrane proteins in phospholipid bilayers give equivalent angular constraints for NMR structure determination.J Phys Chem B. 2010 Nov 11;114(44):13995-4003. doi: 10.1021/jp106043w. J Phys Chem B. 2010. PMID: 20961141 Free PMC article.
-
Structure determination of a membrane protein with two trans-membrane helices in aligned phospholipid bicelles by solid-state NMR spectroscopy.J Am Chem Soc. 2006 Sep 20;128(37):12256-67. doi: 10.1021/ja063640w. J Am Chem Soc. 2006. PMID: 16967977 Free PMC article.
-
Structure determination of membrane proteins by NMR spectroscopy.Biochem Cell Biol. 2002;80(5):597-604. doi: 10.1139/o02-154. Biochem Cell Biol. 2002. PMID: 12440700 Free PMC article. Review.
Cited by
-
Dynamic membrane interactions of antibacterial and antifungal biomolecules, and amyloid peptides, revealed by solid-state NMR spectroscopy.Biochim Biophys Acta Gen Subj. 2018 Feb;1862(2):307-323. doi: 10.1016/j.bbagen.2017.06.004. Epub 2017 Jun 6. Biochim Biophys Acta Gen Subj. 2018. PMID: 28599848 Free PMC article. Review.
-
Exploring the World of Membrane Proteins: Techniques and Methods for Understanding Structure, Function, and Dynamics.Molecules. 2023 Oct 19;28(20):7176. doi: 10.3390/molecules28207176. Molecules. 2023. PMID: 37894653 Free PMC article. Review.
-
Structure and Dynamics of the EGF Receptor as Revealed by Experiments and Simulations and Its Relevance to Non-Small Cell Lung Cancer.Cells. 2019 Apr 5;8(4):316. doi: 10.3390/cells8040316. Cells. 2019. PMID: 30959819 Free PMC article. Review.
-
1H-detected MAS solid-state NMR experiments enable the simultaneous mapping of rigid and dynamic domains of membrane proteins.J Magn Reson. 2017 Dec;285:101-107. doi: 10.1016/j.jmr.2017.09.003. J Magn Reson. 2017. PMID: 29173803 Free PMC article.
-
Interaction of Monomeric Interleukin-8 with CXCR1 Mapped by Proton-Detected Fast MAS Solid-State NMR.Biophys J. 2017 Dec 19;113(12):2695-2705. doi: 10.1016/j.bpj.2017.09.041. Biophys J. 2017. PMID: 29262362 Free PMC article.
References
-
- Urbina J, Waugh JS. Application of proton-enhanced nuclear induction spectroscopy to the study of membranes. Annals of the New York Academy of Sciences. 1973;222:733–739. - PubMed
-
- Pines A, Gibby MG, Waugh JS. Proton-Enhanced Nuclear Induction Spectroscopy. A Method for High Resolution NMR of Dilute Spins in Solids. J Chem Phys. 1972;56:1776–1777.
-
- Pines A, Gibby MG, Waugh JS. Proton-enhanced NMR of dilute spins in solids. J Chem Phys. 1973;59:569–590.
-
- Waugh JS, Huber LM, Haeberlen U. Approach to high-resolution NMR in solids. Phys Rev Lett. 1968;20:180–182.
Publication types
MeSH terms
Substances
Grants and funding
LinkOut - more resources
Full Text Sources
Other Literature Sources
