

Soluble P-selectin predicts lower extremity peripheral artery disease incidence and change in the ankle brachial index: the Multi-Ethnic Study of Atherosclerosis (MESA)
- PMID: 25682040
- PMCID: PMC4361295
- DOI: 10.1016/j.atherosclerosis.2015.01.022
Soluble P-selectin predicts lower extremity peripheral artery disease incidence and change in the ankle brachial index: the Multi-Ethnic Study of Atherosclerosis (MESA)
Abstract
Objective: To determine the association of circulating P-selectin with prevalent and incident peripheral artery disease (PAD), the ankle brachial index (ABI), and change in the ABI.
Methods: The Multi-Ethnic Study of Atherosclerosis (MESA) is a prospective population-based cohort study including 6814 European descent, African American, Hispanic and Chinese men and women aged 45-84 at baseline. Four clinical exams took place after the baseline exam. After excluding those with ABI>1.4, prevalent and incident PAD were defined as an ABI≤0.90. ABI progression was defined as progression from a normal ABI (0.91-1.4) to abnormal (≤0.90 or >1.4) at a later exam.
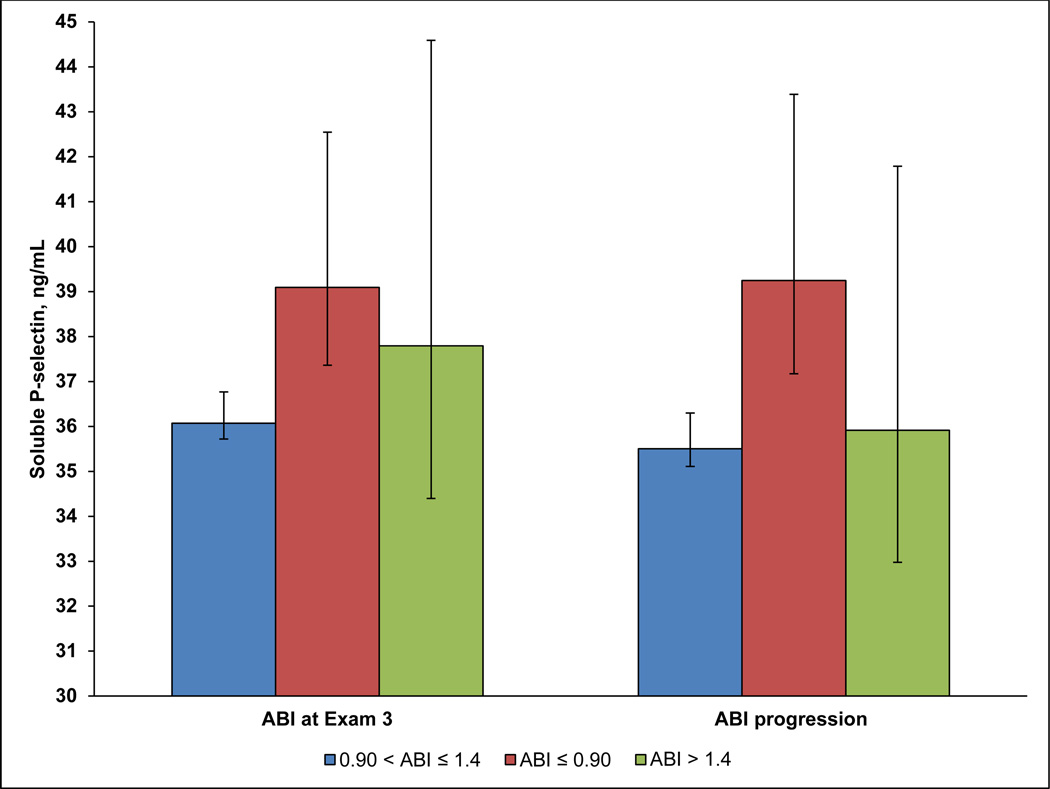
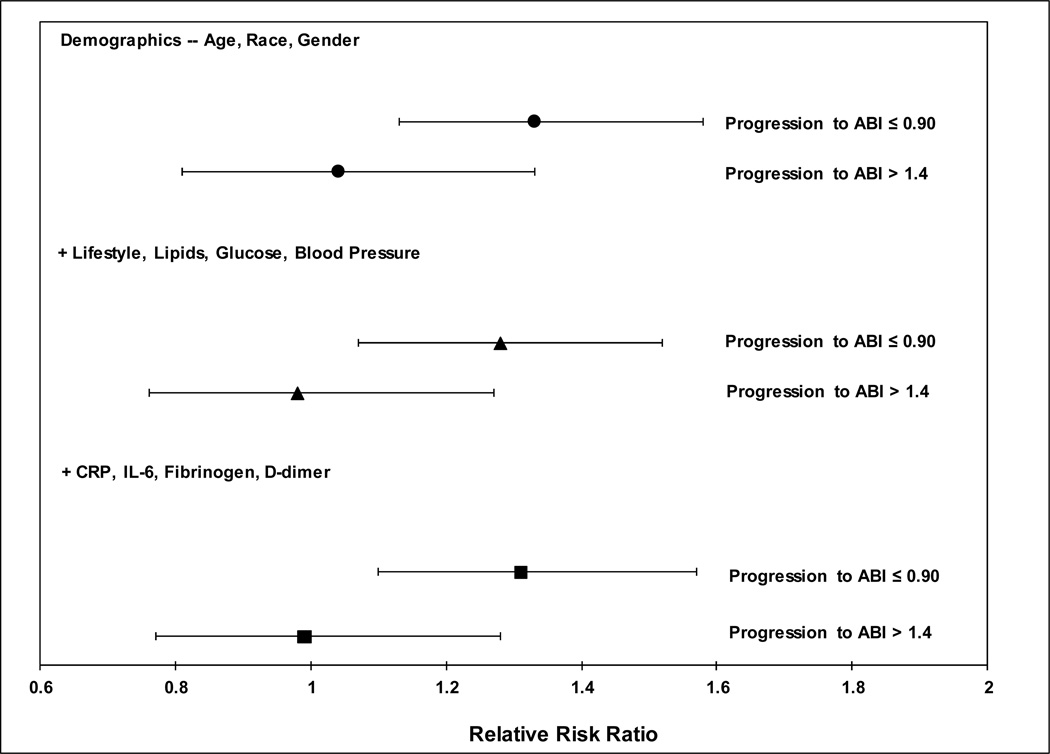
Results: In adjusted models, each SD (13 ng/mL) higher P-selectin was significantly associated with 0.007 lower ABI (95% CI ((-0.011, -0.004)), p < 0.001), and an average change in the ABI of -0.006 ((-0.010, -0.003, p < 0.001). P-selectin was significantly associated with a 1.17-fold greater odds of prevalent PAD ((1.02, 1.33), p = 0.03), and a 30% greater risk of incident PAD ((1.11, 1.53), p = 0.001), as well as progression from a normal ABI to an ABI≤ 0.90 (p = 0.003), but not to an ABI>1.4 (p = 0.96). Addition of P-selectin to models containing traditional PAD risk factors and markers of inflammation/coagulation significantly improved the net reclassification for ABI progression (p = 0.03), but was only marginally significant for incident PAD (p = 0.06).
Conclusions: P-selectin is significantly associated with the development of PAD. However, further research is needed in population-based studies to confirm prospective associations of P-selectin with incident PAD and change in the ABI, as well as its potential predictive ability.
Keywords: Ankle brachial index; Incidence; Net reclassification improvement; P-selectin; Peripheral artery disease; Prediction.
Copyright © 2015 Elsevier Ireland Ltd. All rights reserved.
Conflict of interest statement
Conflicts of Interest: The authors have none to disclose.
Figures
References
-
- Fowkes FG, Rudan D, Rudan I, Aboyans V, Denenberg JO, McDermott MM, et al. Comparison of global estimates of prevalence and risk factors for peripheral artery disease in 2000 and 2010: a systematic review and analysis. Lancet. 2013 - PubMed
-
- Criqui MH, Langer RD, Fronek A, Feigelson HS, Klauber MR, McCann TJ, et al. Mortality over a period of 10 years in patients with peripheral arterial disease. N Engl J Med. 1992;326:381–386. - PubMed
-
- Golomb BA, Dang TT, Criqui MH. Peripheral arterial disease: morbidity and mortality implications. Circulation. 2006;114:688–699. - PubMed
-
- Resnick HE, Lindsay RS, McDermott MM, Devereux RB, Jones KL, Fabsitz RR, et al. Relationship of high and low ankle brachial index to all-cause and cardiovascular disease mortality: the Strong Heart Study. Circulation. 2004;109:733–739. - PubMed
Publication types
MeSH terms
Substances
Grants and funding
- N01 HC95163/HC/NHLBI NIH HHS/United States
- N01 HC 95167/HC/NHLBI NIH HHS/United States
- N01 HC095169/HL/NHLBI NIH HHS/United States
- N01 HC095161/HC/NHLBI NIH HHS/United States
- N01 HC095164/HC/NHLBI NIH HHS/United States
- UL1-TR-000040/TR/NCATS NIH HHS/United States
- N01 HC095169/HC/NHLBI NIH HHS/United States
- N01 HC095165/HC/NHLBI NIH HHS/United States
- N01 HC095168/HC/NHLBI NIH HHS/United States
- UL1 TR000040/TR/NCATS NIH HHS/United States
- N01 HC095163/HC/NHLBI NIH HHS/United States
- N01 HC095162/HC/NHLBI NIH HHS/United States
- N01 HC095159/HC/NHLBI NIH HHS/United States
- UL1 RR025005/RR/NCRR NIH HHS/United States
- UL1-RR-025005/RR/NCRR NIH HHS/United States
- N01 HC095167/HC/NHLBI NIH HHS/United States
- N01 HC095166/HC/NHLBI NIH HHS/United States
- R01 HL098077/HL/NHLBI NIH HHS/United States
- N01 HC095160/HC/NHLBI NIH HHS/United States
- KL2 TR001874/TR/NCATS NIH HHS/United States
- N01 HC095159/HL/NHLBI NIH HHS/United States
LinkOut - more resources
Full Text Sources
Other Literature Sources
Medical
Miscellaneous
