. 2015 Feb 20;6(5):3375-93.
doi: 10.18632/oncotarget.3270.

A Golgi-based KDELR-dependent signalling pathway controls extracellular matrix degradation

Affiliations

A Golgi-based KDELR-dependent signalling pathway controls extracellular matrix degradation

Carmen Ruggiero et al. Oncotarget. .

Abstract

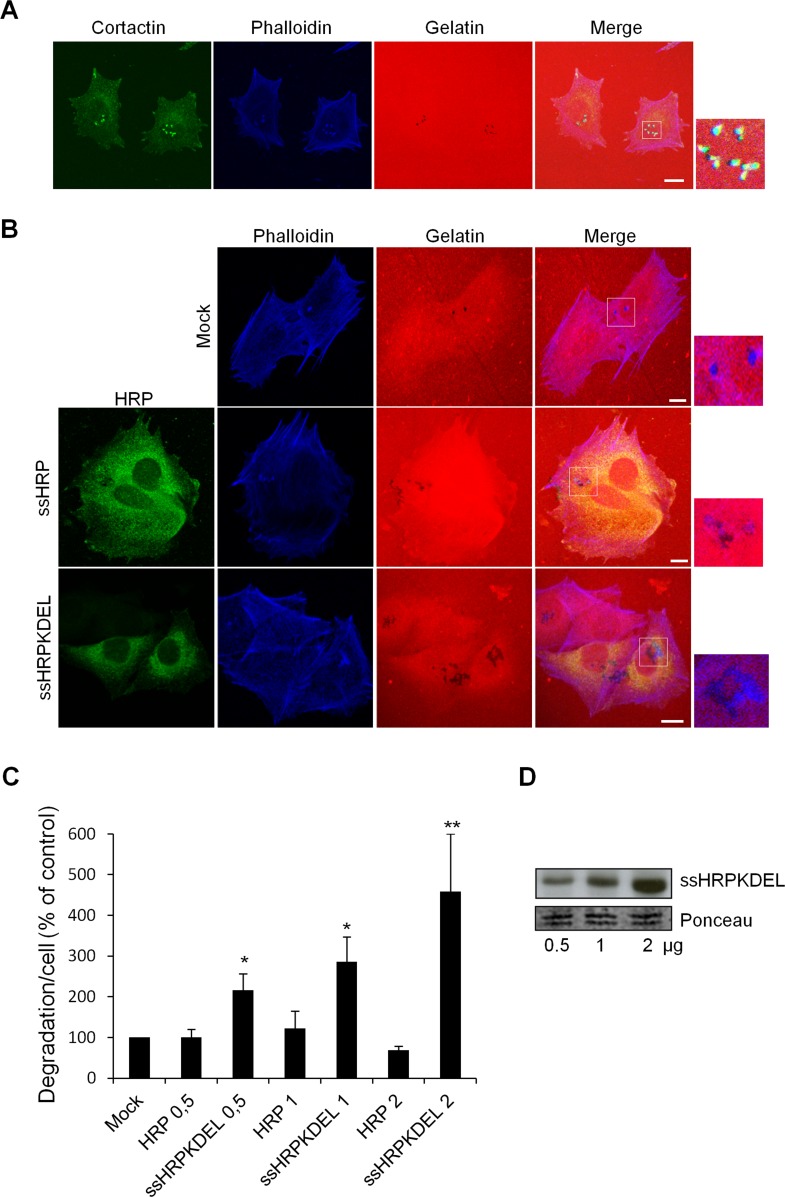
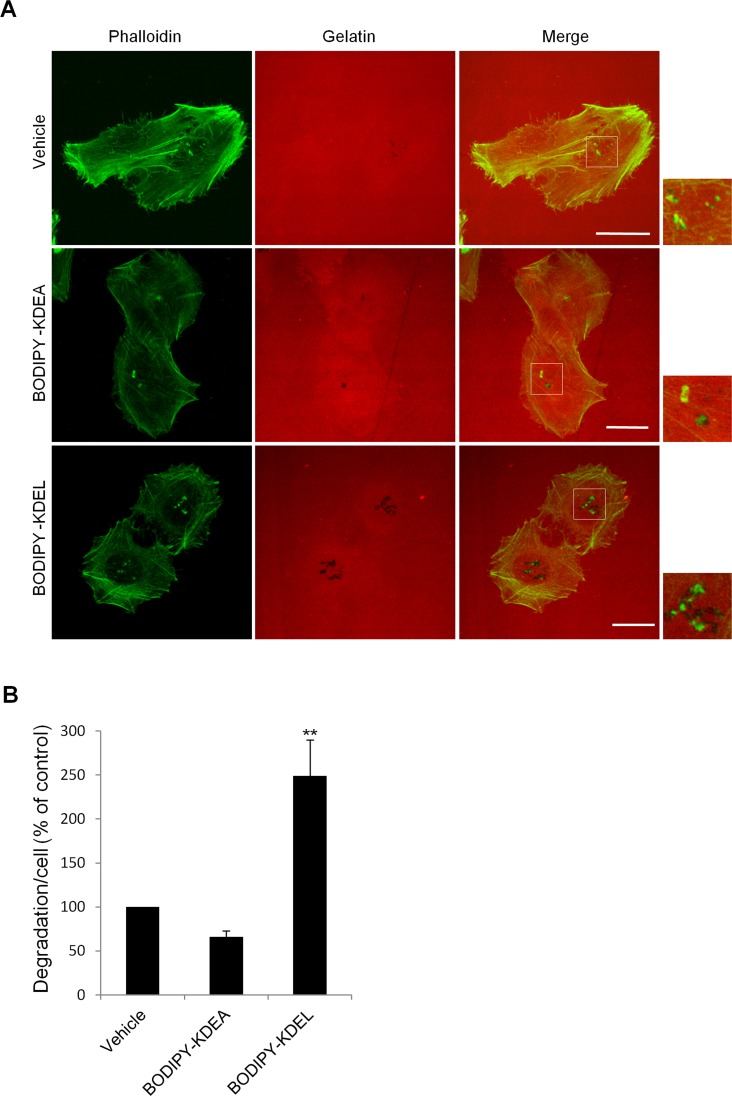
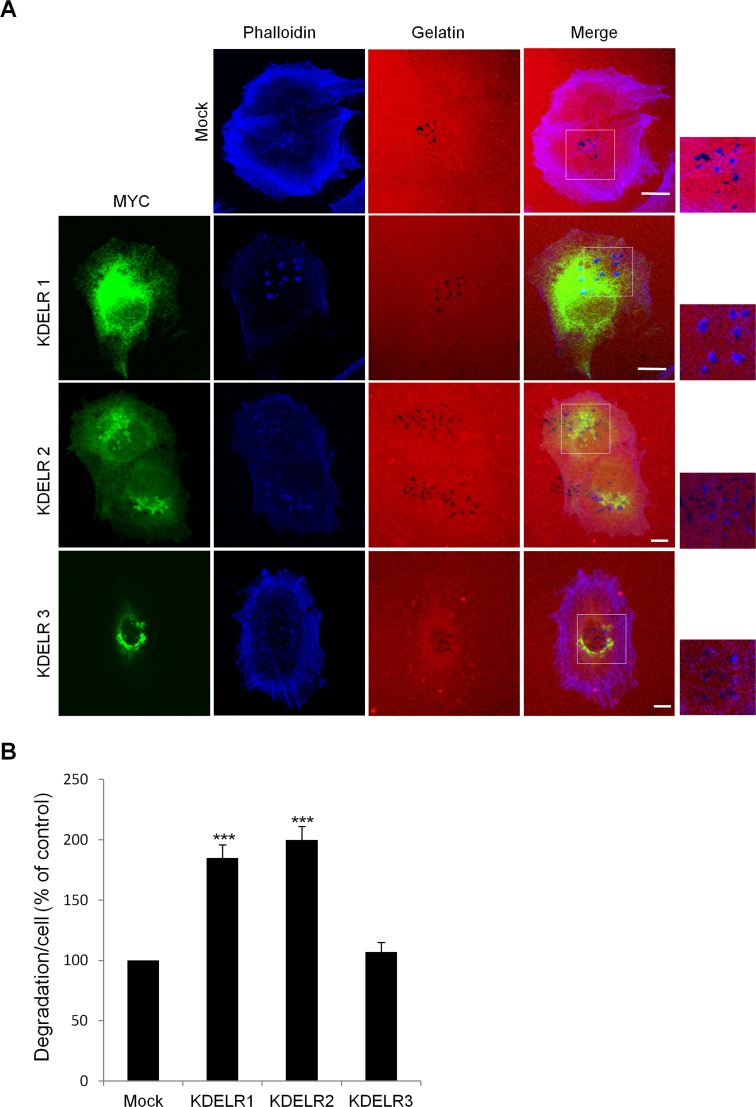
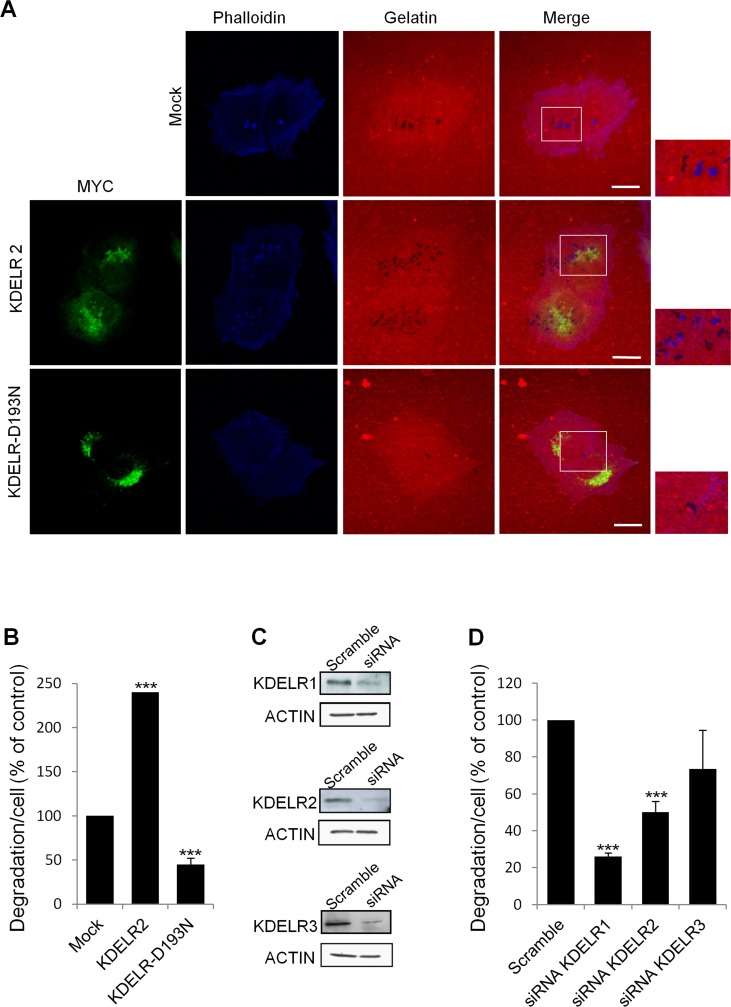
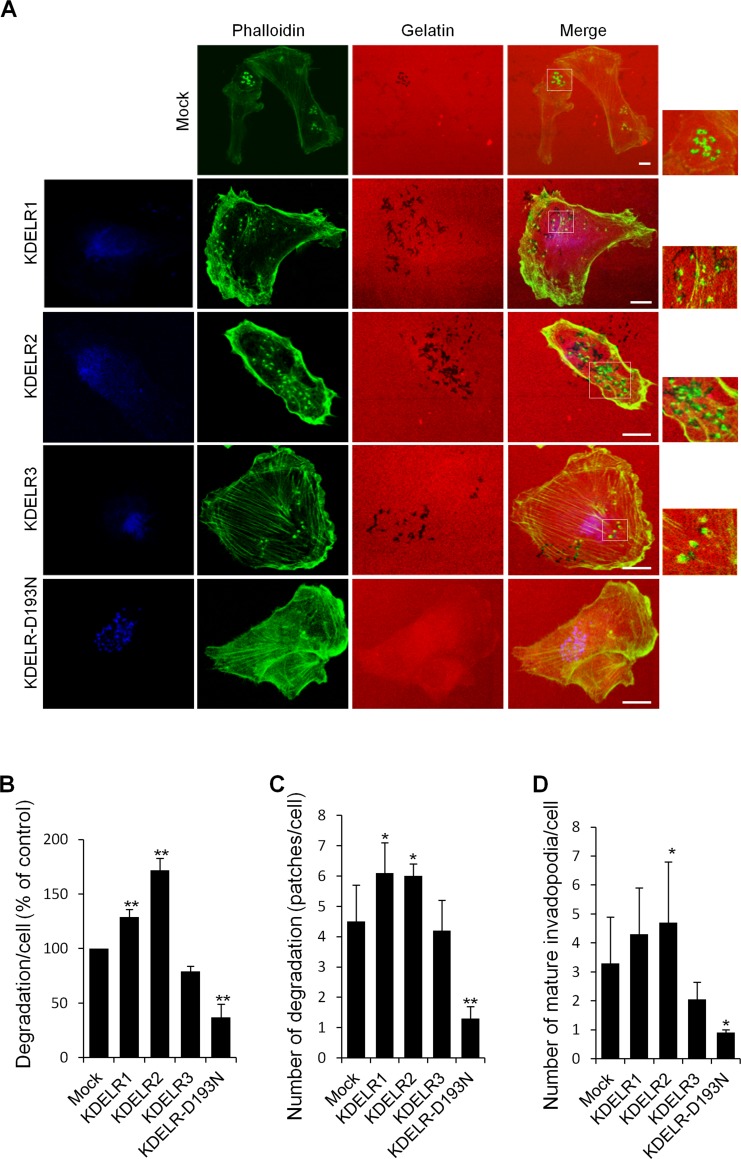
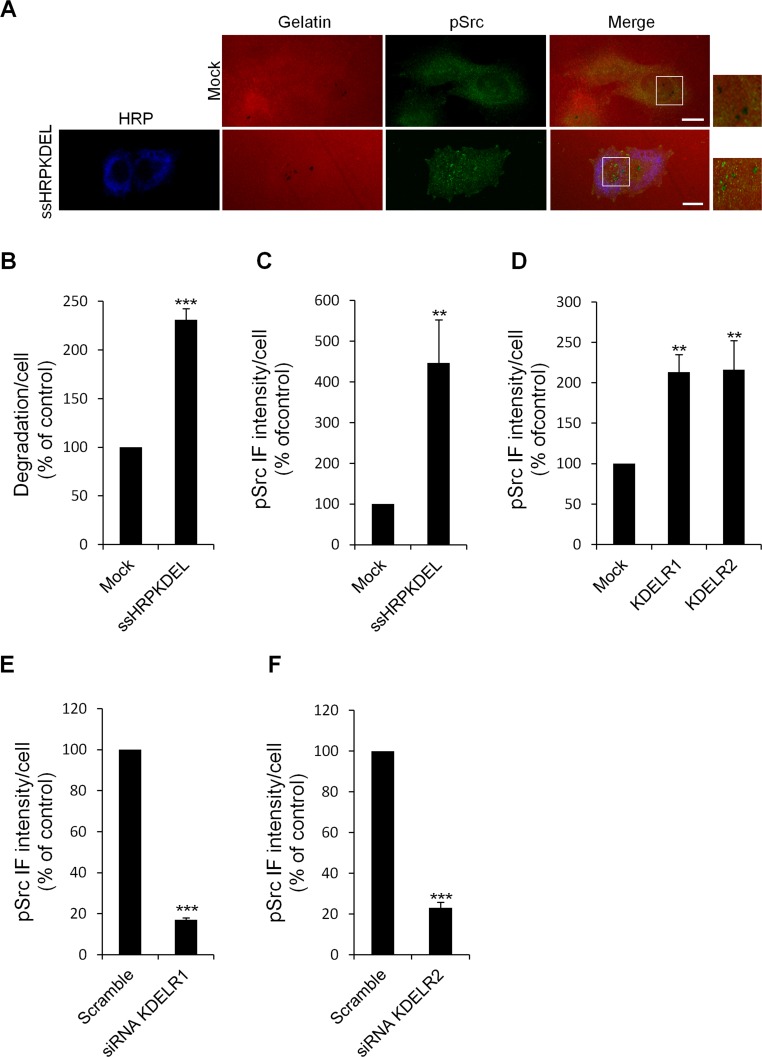
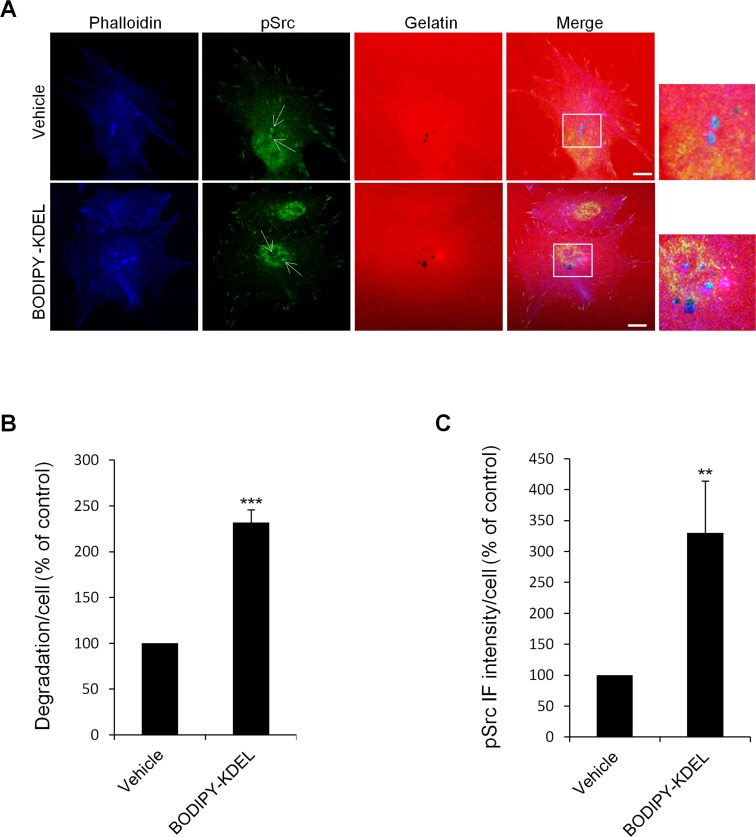
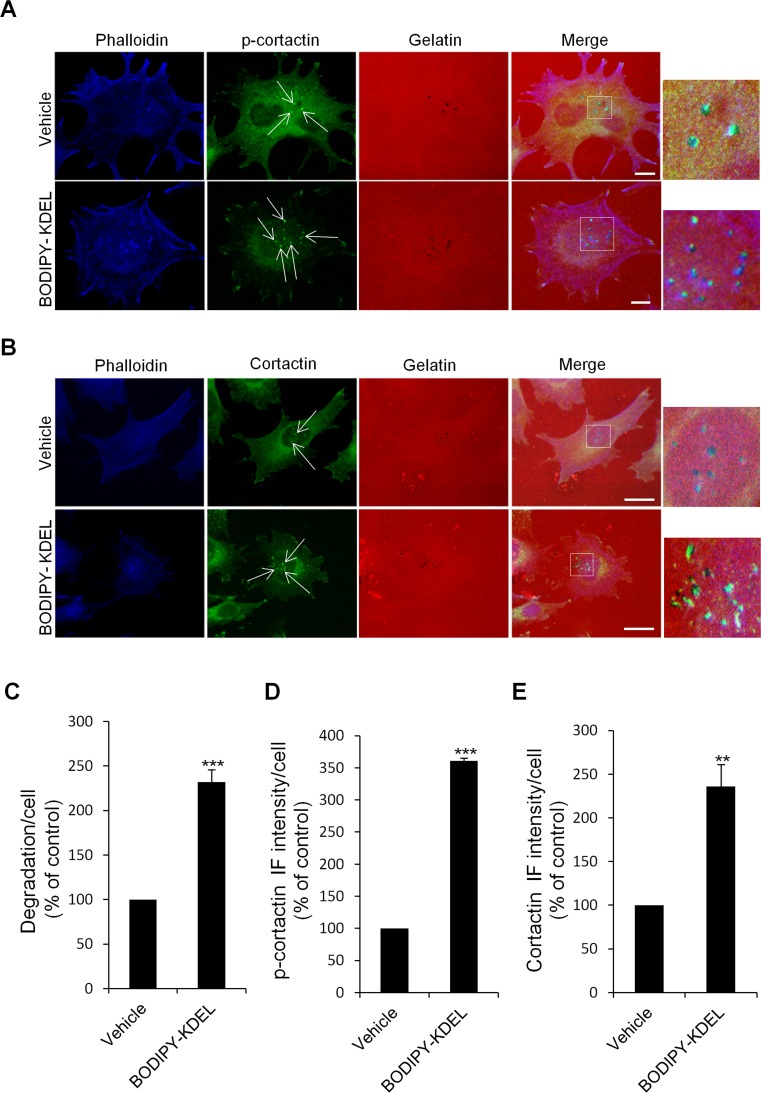
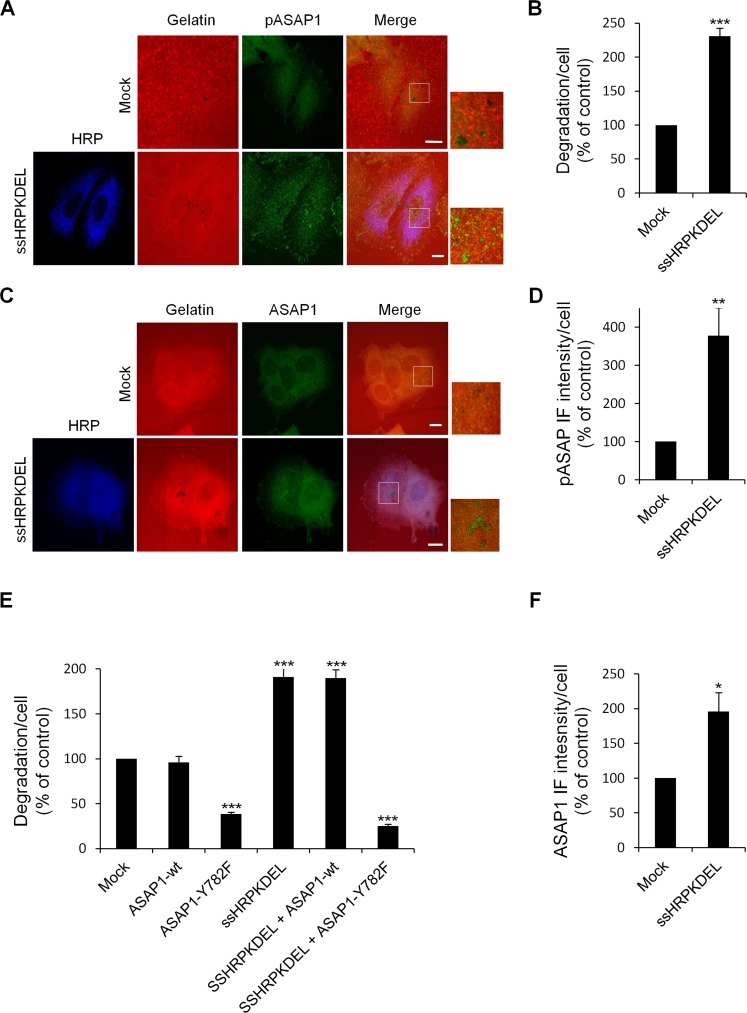
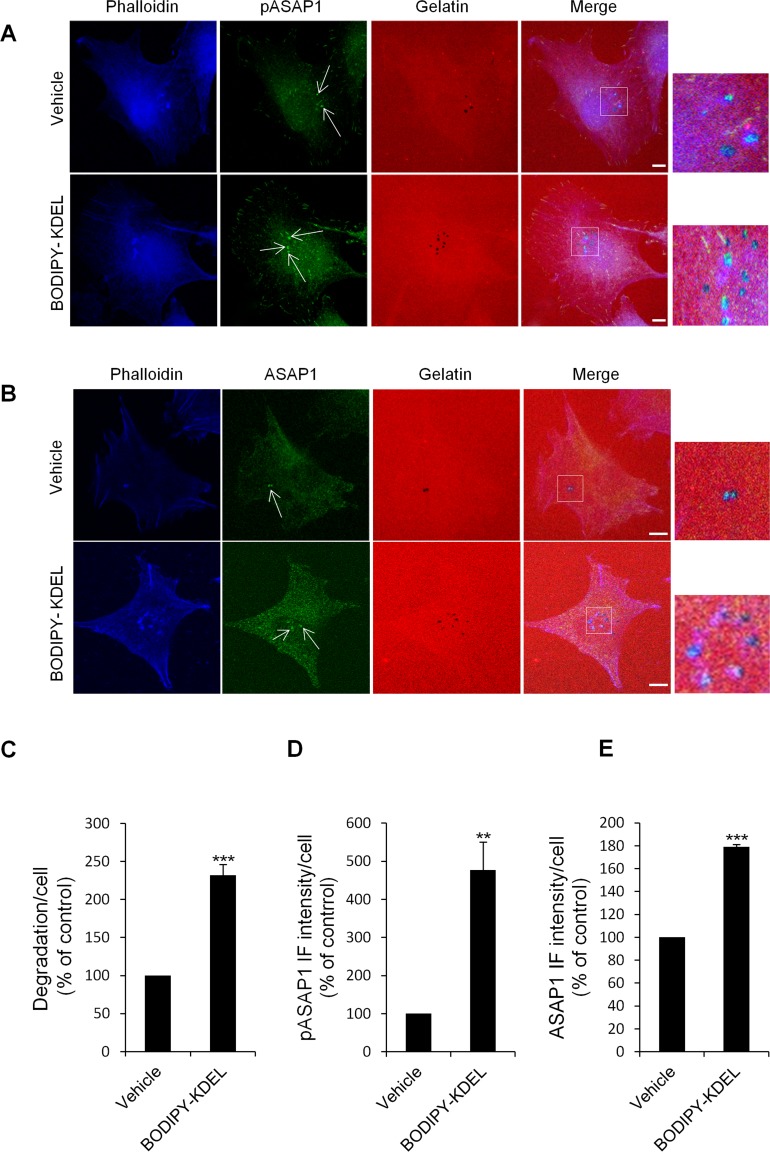
We recently identified an endomembrane-based signalling cascade that is activated by the KDEL receptor (KDELR) on the Golgi complex. At the Golgi, the KDELR acts as a traffic sensor (presumably via binding to chaperones that leave the ER) and triggers signalling pathways that balance membrane fluxes between ER and Golgi. One such pathway relies on Gq and Src. Here, we examine if KDELR might control other cellular modules through this pathway. Given the central role of Src in extracellular matrix (ECM) degradation, we investigated the impact of the KDELR-Src pathway on the ability of cancer cells to degrade the ECM. We find that activation of the KDELR controls ECM degradation by increasing the number of the degradative structures known as invadopodia. The KDELR induces Src activation at the invadopodia and leads to phosphorylation of the Src substrates cortactin and ASAP1, which are required for basal and KDELR-stimulated ECM degradation. This study furthers our understanding of the regulatory circuitry underlying invadopodia-dependent ECM degradation, a key phase in metastases formation and invasive growth.


Conflict of interest statement

The authors declare no conflict of interest.

Figures

Figure 1
Figure 1. KDELR stimulation by overexpression of the KDELR ligand ssHRPKDEL increases degradation of the ECM
(A) A375MM cells were grown in complete medium (with 10% serum) on rhodamine-conjugated crosslinked gelatine (red) for 16 h in the presence of BB94. Following BB94 wash-out, the cells were incubated for a further 3 h, and then fixed and stained with phalloidin (blue) and cortactin (green). Merged images of blue green and red signals are also shown (Merge). Invadopodia are evident in the enlargement of the boxed region (small right panel: green, blue and red signals). (B) A375MM cells were transfected with empty vector (Mock), ssHRP (2 μg), or ssHRP-KDEL (2 μg), and treated as in A. The cells were then fixed and stained with an anti-HRP antibody (green) and phalloidin (blue). Merged images of red and blue(Mock) and red, blue and green signals (ssHRP and ssHRP ssHRPKDEL) are also shown (Merge). Invadopodia are shown in the enlargements of the boxed regions (small right panels: blue and red signals). (A, B). Scale bars, 10 μm. The images are representative of three independent experiments. (C) Cells transfected with increasing concentrations (0.5, 1, 2 μg) ssHRP or ssHRPKDEL were processed as in A. Data are degradation area per cell (% of control), as means ±SEM from three independent experiments, with at least 100 cells quantified per experiment. *p<0.05, **p <0.01, compared to Mock (control) cells (t-test). (D) A375MM cells transfected with increasing concentrations (0.5, 1, 2 μg) of ssHRPKDEL were lysed and analyzed by immunoblotting with an anti-HRP antibody (upper panel). A region of the nitrocellulose membrane stained by ponceau red is shown as a loading control (lower panel).
Figure 2
Figure 2. KDELR stimulation by Bodipy-KDEL promotes ECM degradation
(A) A375MM cells were grown on rhodamine-conjugated crosslinked gelatine (red) for 16 h in the presence of BB94. Following BB94 wash-out, the cells were incubated for a further 3 h with the membrane permeant KDELR agonist Bodipy-KDEL (3 μM) or the control peptide Bodipy-KDEA (3 μM) (as indicated). As an additional control, the cells were incubated with vehicle alone (Vehicle). After fixing, the cells were stained with phalloidin (green). Merged images of red and green signals are also shown (Merge). Invadopodia are shown in the enlargements of the boxed regions (small right panels: green and red signals). Scale bars, 10 μm. The images are representative of three independent experiments. (B) Quantification of the degradation area per cell. Data are degradation area per cell (% of control), as means ±SEM of three independent experiments, with at least 100 cells quantified per experiment. ** p<0.01, compared to Vehicle cells (t-test).
Figure 3
Figure 3. The ECM degradation process is differentially regulated by the KDELR isoforms
(A) A375MM cells were transfected with empty vector (Mock) or the myc-tagged KDELR isoforms, for KDELR1, KDELR2 and KDELR3, and grown on rhodamine-conjugated (red) crosslinked gelatine for 16 h in the presence of BB94. Following BB94 wash-out, the cells were incubated for a further 3 h, then fixed and stained with an anti-myc antibody to visualise transfected cells (green) and phalloidin (blue). Merged images of red and blue (Mock) and red, blue and green signals (KDELRs) are also shown (Merge) Invadopodia are shown in the enlargements of the boxed regions (small right panels: blue and red signals). Scale bars, 10 μm. The images are representative of three independent experiments. (B) Quantification of the degradation area per cell. Data are degradation area per cell (% of control), as means ±SEM from three independent experiments, with at least 100 cells quantified per experiment. ***p <0.001, compared to Mock cells (t-test).
Figure 4
Figure 4. KDELR inhibition impairs degradation of the ECM
(A) A375MM cells were transfected with empty vector (Mock), KDELR2-myc or KDELR-D193N-myc (as indicated) for 24 h, and grown on rhodamine-conjugated crosslinked gelatine (red) for 16 h in the presence of BB94. Following BB94 wash-out, the cells were incubated for a further 3 h and then fixed and stained with -phalloidin (blue, Mock) and an anti-myc antibody (green, KDELR2-myc and KDELR-D193N-myc). Merged images of red and blue (Mock) and red, blue and green signals (KDER2 and KDELR-D193NL) are also shown. Invadopodia are shown in the enlargements of the boxed regions (small right panels: blue and red signals). Scale bars, 10 μm. The images are representative of at least four independent experiments. (B) Quantification of the degradation area per cell. Data are degradation area per cell (% of control), as means ±SEM of four independent experiments, with at least 100 cells quantified per experiment. ***p <0.001, compared to Mock cells (t-test). (C) A375MM cells were treated without (Scramble) or with siRNAs targeting KDELR1, KDELR2 and KDELR3 (siRNA KDELR) for 96 h. KDELR1, KDELR2, and KDELR3 expression levels were assessed by Western blotting, using a pan anti-KDELR antibody, an antibodies specifically directed against KDELR2 and KDELR3, respectively. Actin was used as loading control. (D) A375MM cells were treated as in C, and then 72-h post interference they were plated for 24 h on rhodamine-conjugated gelatine in the presence of BB94. Following the BB94wash-out, the cells were incubated for a further 3 h, then fixed and scored for their ability to degrade the ECM. Data are degradation area per cell (% of control), as means ±SEM from three independent experiments, with at least 100 cells quantified per experiment. ***p <0.001, compared to Scrambled cells (t-test).
Figure 5
Figure 5. KDELR modulates the degradation of the ECM and the formation of invadopodia in MDA-MB-231 cells
(A) MDA-MB-231 cells were transfected with empty vector (Mock) or the myc-tagged KDELR isoforms, for KDELR1, KDELR2, KDELR3, or KDELR-D193N-myc (as indicated) and grown on rhodamine-conjugated (red) crosslinked gelatine for 16 h in the presence of BB94. Following BB94 wash-out, the cells were incubated for 90 min and then fixed and stained with phalloidin (green) and an anti-myc antibody (blue, KDELR2-myc and KDELR-D193N-myc). Merged images of red and green (Mock) and red, green and blue signals (KDELRs and KDELR-D193N) are also shown (Merge) Invadopodia are shown in the enlargements of the boxed regions (small right panels: green and red signals). Scale bars, 10 μm. The images are representative of three independent experiments. (B) Quantification of the degradation area per cell (% of control). (C) Quantification of the number of degradation patches per cell (D) Quantification of the number of mature invadopodia per cell. Data are expressed, as means ±SEM of three independent experiments, with at least 50 cells quantified per experiment. **p <0.01, **p <0.05 compared to Mock cells (t-test).
Figure 6
Figure 6. KDELR stimulation increases the levels of active Src in the cell regions overlapping the ECM degradation patches
(A) A375MM cells were transfected with the empty vector (Mock) or ssHRPKDEL and grown on rhodamine-conjugated crosslinked gelatine (red) for 16 h in the presence of BB94. Following BB94 wash-out, the cells were incubated for a further 3 h, and then fixed and stained for pSrc (pTyr 419, green). An anti-HRP antibody (blue) was used to visualise ssHRPKDEL-transfected cells. Merged images of red and green (Mock) and red, green and blue signals (ssHRPKDEL) are also shown (Merge). pSrc immunofluorescence overlapping the degradation patches are shown in the enlargements of the boxed regions (small right panels: red and green signals). Scale bars, 10 μm. The images are representative of three independent experiments. (B) Quantification of the degradation area per cell. Data are degradation area per cell (% of control), as means ±SEM of three independent experiments, with at least 100 cells quantified per experiment. (C) Quantification of pSrc immunofluorescence levels in the cell regions overlapping the ECM degradation patches. Data are means ±SEM of pSrc immunofluorescence per cell (% of control), from three independent experiments, with at least 100 cells quantified per experiment.. (D) A375MM cells were transfected with the empty vector (Mock) or the myc-tagged KDELR isoforms, KDELR1 and KDELR2, and grown on rhodamine-conjugated crosslinked gelatine for 16 h in the presence of BB94. Following BB94 wash-out, the cells were incubated for a further 3 h, and then fixed and labelled for pSrc. Data are means ±SEM, as indicated for C. (E-F) A375MM cells were treated without (Scramble) or with siRNA targeting KDELR1 or KDELR2 (siRNA KDELR) for 96 h. Seventy-two hours post interference, the cells were plated for 24 h on rhodamine-conjugated gelatine in the presence of BB94. Following the wash-out of the BB94, the cells were incubated for a further 3 h, then fixed and labelled for pSrc. Data are means ±SEM, as indicated for C. (B-E) ***p <0.001, **p <0.01 compared to Mock cells (t-test).
Figure 7
Figure 7. KDELR stimulation by Bodipy-KDEL activates Src to invadopodia
(A) A375MM cells were grown on rhodamine-conjugated crosslinked gelatine (red) for 16 h in the presence of BB94. Following BB94 wash-out, the cells were incubated for a further 3 h with the membrane permeant KDELR agonist Bodipy-KDEL (3 μM) or with vehicle alone (Vehicle) as a control. After fixing, the cells were stained for pSrc (pTyr 419, green) and phalloidin (blue). Merged images of red, green and blue signals are also shown (Merge). pSrc immunofluorescence overlapping the invadopodia are shown in the enlargements of the boxed regions (small right panels: red green and blue signals). White arrows point to pSrc spots at invadopodia. Scale bars, 10 μm. The images are representative of two independent experiments. (B) Quantification of the degradation area per cell. Data are degradation area per cell (% of control), as means ±SEM of two independent experiments, with at least 50 cells quantified per experiment. *** p<0.001, compared to Vehicle cells (t-test). (C) Quantification of pSrc immunofluorescence at invadopodia. Data are means ±SEM of pSrc immunofluorescence per cell (% of control), from two independent experiments, with at least 50 cells quantified per experiment. ** p<0.001, compared to Vehicle cells (t-test).
Figure 8
Figure 8. KDELR stimulation by Bodipy-KDEL triggers the phosphorylation of cortactin at invadopodia
(A) A375MM cells were grown on rhodamine-conjugated crosslinked gelatine (red) for 16 h in the presence of BB94. Following BB94 wash-out, the cells were incubated for a further 3 h with the membrane permeant KDELR agonist Bodipy-KDEL (3 μM) or with vehicle alone (Vehicle) as a control. After fixing, the cells were stained for p-cortactin (Tyr 421 of cortactin, green) and phalloidin (blue). Merged images of red, green and blue signals are also shown (Merge). p-cortactin immunofluorescence overlapping the invadopodia are shown in the enlargements of the boxed regions (small right panels: red green and blue signals). White arrows point to p-cortactin spots at invadopodia. (B) KDELR stimulation increases cortactin to invadopodia. A375MM cells were treated as in A, fixed, and stained for cortactin (green) and phalloidin (blue). Merged images of red, green and blue signals are also shown (Merge). Cortactin immunofluorescence overlapping the invadopodia are shown in the enlargements of the boxed regions (small right panels: red green and blue signals). White arrows point to cortactin spots at invadopodia. (A, B) The images are representative of three independent experiments. Scale bars, 10 μm. (C) Quantification of the degradation area per cell. Data are degradation area per cell (% of control), as means ±SEM of three independent experiments, with at least 50 cells quantified per experiment. *** p<0.001, compared to vehicle cells (t-test). (D) Quantification of p-cortactin immunofluorescence at invadopodia. Data are means ±SEM of p-cortactin immunofluorescence per cell (% of control), from three independent experiments, with at least 50 cells quantified per experiment. *** p<0.001, compared to vehicle treated cells (t-test). (E) Quantification of cortactin immunofluorescence at invadopodia. Data are means ±SEM, as indicated for C. **p <0.01, compared to vehicle treated cells (t-test).
Figure 9
Figure 9. ASAP1 is involved in KDELR-dependent ECM degradation
(A) KDELR stimulation increases the levels of phosphorylated ASAP1 in areas of ECM degradation. A375MM cells were transfected with the empty vector (Mock) or ssHRPKDEL, and grown on rhodamine-conjugated crosslinked gelatine (red) for 16 h in the presence of BB94. Following BB94 wash-out, the cells were incubated for a further 3 h and then fixed and stained for pASAP1 (pTyr 782, green). An anti-HRP antibody (blue) was used to visualise ssHRPKDEL-transfected cells. Merged images of red and green (Mock) and red, green and blue signals are also shown (Merge). pASAP1 immunofluorescence overlapping the degradation patches are shown in the enlargements of the boxed regions (small right panels: red and green signals). The images are representative of three independent experiments. (B) Quantification of the degradation area per cell. Data are degradation area per cell (% of control), as means ±SEM of three independent experiments. In each experiment, at least 100 cells were quantified. (C) KDELR stimulation increases ASAP1 recruitment to areas of degradation. A375MM cells were treated as in A, fixed, and stained for ASAP1 (green). An anti-HRP antibody (blue) was used to visualise ssHRPKDEL-transfected cells. Merged images of red and green (Mock) and red, green and blue signals are also shown (Merge). ASAP1 immunofluorescence overlapping the degradation patches are shown in the enlargements of the boxed regions (small right panels: red and green signals). The images are representative of three independent experiments. (D) Quantification of pASAP1 immunofluorescence in the cell regions overlapping the ECM degradation patches. Data are means ±SEM of pASAP1 immunofluorescence per cell (% of control), of three independent experiments. In each experiment at least 100 cells were quantified. (A, C) Scale bars, 10 μm. (E) The ASAP1 Y782F mutant inhibit ECM degradation. A375MM cells were transfected with empty vector (Mock), Flag-tagged ASAP1-wt or the Flag-tagged ASAP1 Y782F mutant. The cells were also transfected with myc-tagged ssHRPKDEL, myc-tagged ssHRPKDEL and ASAP1-wt, or myc-tagged ssHRPKDEL and ASAP1 Y782F. Following BB94wash-out, the cells were incubated for a further 3 h, then fixed, stained and scored for degradation of the ECM. Quantification of the degradation area per cell. Data are means ±SEM, as indicated for B. ***p<0.001, ASAP1 Y782F versus Mock; ssHRPKDEL versus Mock; ssHRPKDEL + ASAP1 Y782F versus ssHRPKDEL (t test). (F) Quantification of ASAP1 immunofluorescence intensity in the cell regions overlapping the ECM degradation patches. Data are means ±SEM of ASAP1 immunofluorescence per cell (% of control), of three independent experiments. In each experiment at least 100 cells were quantified. (B, D, F) ***p <0.001, **p <0.01, *p <0.05 compared to Mock cells (t-test).
Figure 10
Figure 10. KDELR stimulation by Bodipy-KDEL triggers the phosphorylation of ASAP1 at invadopodia
(A) A375MM cells were grown on rhodamine-conjugated crosslinked gelatine (red) for 16 h in the presence of BB94. Following BB94 wash-out, the cells were incubated for a further 3 h with the membrane permeant KDELR agonist Bodipy-KDEL (3 μM) or with vehicle alone (Vehicle) as a control. After fixing, the cells were stained for pASAP1 (pTyr 782, green) and phalloidin (blue). Merged images of red, green and blue signals are also shown (Merge). pASAP1 immunofluorescence overlapping the invadopodia are shown in the enlargements of the boxed regions (small right panels: red, green and blue signals).. White arrows point to pASAP1 spots at invadopodia. (B) KDELR stimulation increases ASAP1 to invadopodia. A375MM cells were treated as in A, fixed, and stained for ASAP1 (green) and phalloidin (blue). Merged images of red, green and blue signals are also shown (Merge). ASAP1 immunofluorescence overlapping the invadopodia are shown in the enlargements of the boxed regions (small right panels: red, green and blue signals). White arrows point to ASAP1 spots at invadopodia. (A, B) The images are representative of three independent experiments. Scale bars, 10 μm. (C) Quantification of the degradation area per cell. Data are degradation area per cell (% of control), as means ±SEM of three independent experiments, with at least 50 cells quantified per experiment. (D) Quantification of pASAP1 immunofluorescence levels at invadopodia. Data are means ±SEM of pASAP1 immunofluorescence per cell (% of control), from three independent experiments, with at least 50 cells quantified per experiment. (E) Quantification of ASAP1 immunofluorescence levels at invadopodia. Data are means ±SEM, as indicated for D. (C, D, E) ***p <0.001, **p <0.001 compared to vehicle treated cells (t-test).

References

    1. Hartwell LH, Hopfield JJ, Leibler S, Murray AW. From molecular to modular cell biology. Nature. 1999;402:C47–52. - PubMed
    1. Csete ME, Doyle JC. Reverse engineering of biological complexity. Science. 2002;295:1664–1669. - PubMed
    1. Sontag ED. Molecular systems biology and control. Eur J Control. 2005;11:396–435.
    1. Cancino J, Capalbo A, Di Campli A, Giannotta M, Rizzo R, Jung JE, Di Martino R, Persico M, Heinklein P, Sallese M, Luini A. Control Systems of Membrane Transport at the Interface between the Endoplasmic Reticulum and the Golgi. Dev Cell. 2014;30:280–294. - PubMed
    1. Giannotta M, Ruggiero C, Grossi M, Cancino J, Capitani M, Pulvirenti T, Consoli GM, Geraci C, Fanelli F, Luini A, Sallese M. The KDEL receptor couples to Galphaq/11 to activate Src kinases and regulate transport through the Golgi. EMBO J. 2012;31:2869–2881. - PMC - PubMed

Publication types

MeSH terms