Non-coding genomic regions possessing enhancer and silencer potential are associated with healthy aging and exceptional survival
- PMID: 25682868
- PMCID: PMC4414140
- DOI: 10.18632/oncotarget.2877
Non-coding genomic regions possessing enhancer and silencer potential are associated with healthy aging and exceptional survival
Abstract
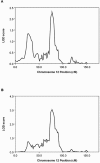
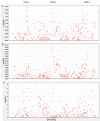
We have completed a genome-wide linkage scan for healthy aging using data collected from a family study, followed by fine-mapping by association in a separate population, the first such attempt reported. The family cohort consisted of parents of age 90 or above and their children ranging in age from 50 to 80. As a quantitative measure of healthy aging, we used a frailty index, called FI34, based on 34 health and function variables. The linkage scan found a single significant linkage peak on chromosome 12. Using an independent cohort of unrelated nonagenarians, we carried out a fine-scale association mapping of the region suggestive of linkage and identified three sites associated with healthy aging. These healthy-aging sites (HASs) are located in intergenic regions at 12q13-14. HAS-1 has been previously associated with multiple diseases, and an enhancer was recently mapped and experimentally validated within the site. HAS-2 is a previously uncharacterized site possessing genomic features suggestive of enhancer activity. HAS-3 contains features associated with Polycomb repression. The HASs also contain variants associated with exceptional longevity, based on a separate analysis. Our results provide insight into functional genomic networks involving non-coding regulatory elements that are involved in healthy aging and longevity.
Figures


Similar articles
-
Whole-Genome Sequencing of a Healthy Aging Cohort.Cell. 2016 May 5;165(4):1002-11. doi: 10.1016/j.cell.2016.03.022. Epub 2016 Apr 21. Cell. 2016. PMID: 27114037 Free PMC article.
-
A genome-wide scan for linkage to human exceptional longevity identifies a locus on chromosome 4.Proc Natl Acad Sci U S A. 2001 Aug 28;98(18):10505-8. doi: 10.1073/pnas.181337598. Epub 2001 Aug 27. Proc Natl Acad Sci U S A. 2001. PMID: 11526246 Free PMC article.
-
Models to explore genetics of human aging.Adv Exp Med Biol. 2015;847:141-61. doi: 10.1007/978-1-4939-2404-2_7. Adv Exp Med Biol. 2015. PMID: 25916590 Review.
-
The search for longevity and healthy aging genes: insights from epidemiological studies and samples of long-lived individuals.J Gerontol A Biol Sci Med Sci. 2012 May;67(5):470-9. doi: 10.1093/gerona/gls089. Epub 2012 Apr 12. J Gerontol A Biol Sci Med Sci. 2012. PMID: 22499766 Free PMC article. Review.
-
Association of healthy aging with parental longevity.Age (Dordr). 2013 Oct;35(5):1975-82. doi: 10.1007/s11357-012-9472-0. Epub 2012 Sep 18. Age (Dordr). 2013. PMID: 22986583 Free PMC article.
Cited by
-
Inflammatory and immune markers associated with physical frailty syndrome: findings from Singapore longitudinal aging studies.Oncotarget. 2016 May 17;7(20):28783-95. doi: 10.18632/oncotarget.8939. Oncotarget. 2016. PMID: 27119508 Free PMC article.
-
Associations between STR autosomal markers and longevity.Age (Dordr). 2015 Oct;37(5):95. doi: 10.1007/s11357-015-9818-5. Epub 2015 Sep 4. Age (Dordr). 2015. PMID: 26335621 Free PMC article.
-
Metabolic and Genetic Markers of Biological Age.Front Genet. 2017 May 23;8:64. doi: 10.3389/fgene.2017.00064. eCollection 2017. Front Genet. 2017. PMID: 28588609 Free PMC article.
-
Cross-sectional and longitudinal associations between late-life depressive symptoms and cognitive deficits: 20-year follow-up of the Kuakini Honolulu-Asia aging study.Arch Gerontol Geriatr. 2024 Dec;127:105551. doi: 10.1016/j.archger.2024.105551. Epub 2024 Jun 25. Arch Gerontol Geriatr. 2024. PMID: 38968756
-
The frailty index outperforms DNA methylation age and its derivatives as an indicator of biological age.Geroscience. 2017 Feb;39(1):83-92. doi: 10.1007/s11357-017-9960-3. Epub 2017 Jan 14. Geroscience. 2017. PMID: 28299637 Free PMC article.
References
-
- Finch CE. Longevity, senescence, and the genome. Chicago: University of Chicago Press; 1990. (1990)
-
- Jazwinski SM. Longevity, genes, and aging. Science. 1996;273:54–59. - PubMed
-
- Guarente L, Kenyon C. Genetic pathways that regulate ageing in model organisms. Nature. 2000;408:255–262. - PubMed
-
- Oeppen J, Vaupel JW. Demography. Broken limits to life expectancy. Science. 2002;296:1029–1031. - PubMed
Publication types
MeSH terms
Grants and funding
LinkOut - more resources
Full Text Sources
Other Literature Sources
Medical
Research Materials

