

Complex history of admixture between modern humans and Neandertals
- PMID: 25683119
- PMCID: PMC4375686
- DOI: 10.1016/j.ajhg.2015.01.006
Complex history of admixture between modern humans and Neandertals
Abstract
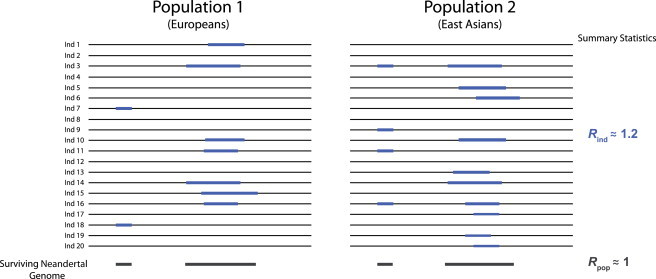
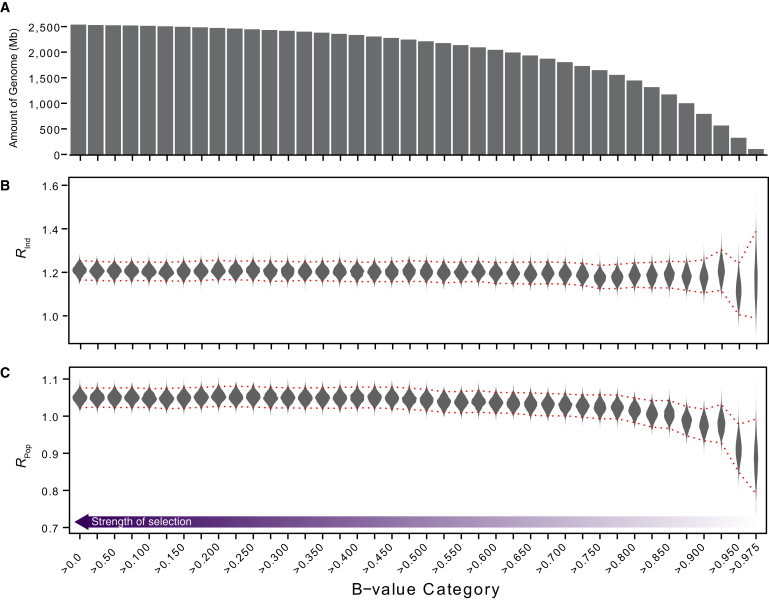
Recent analyses have found that a substantial amount of the Neandertal genome persists in the genomes of contemporary non-African individuals. East Asians have, on average, higher levels of Neandertal ancestry than do Europeans, which might be due to differences in the efficiency of purifying selection, an additional pulse of introgression into East Asians, or other unexplored scenarios. To better define the scope of plausible models of archaic admixture between Neandertals and anatomically modern humans, we analyzed patterns of introgressed sequence in whole-genome data of 379 Europeans and 286 East Asians. We found that inferences of demographic history restricted to neutrally evolving genomic regions allowed a simple one-pulse model to be robustly rejected, suggesting that differences in selection cannot explain the differences in Neandertal ancestry. We show that two additional demographic models, involving either a second pulse of Neandertal gene flow into the ancestors of East Asians or a dilution of Neandertal lineages in Europeans by admixture with an unknown ancestral population, are consistent with the data. Thus, the history of admixture between modern humans and Neandertals is most likely more complex than previously thought.
Copyright © 2015 The American Society of Human Genetics. Published by Elsevier Inc. All rights reserved.
Figures

Similar articles
-
Selection and reduced population size cannot explain higher amounts of Neandertal ancestry in East Asian than in European human populations.Am J Hum Genet. 2015 Mar 5;96(3):454-61. doi: 10.1016/j.ajhg.2014.12.029. Epub 2015 Feb 12. Am J Hum Genet. 2015. PMID: 25683122 Free PMC article.
-
Higher levels of neanderthal ancestry in East Asians than in Europeans.Genetics. 2013 May;194(1):199-209. doi: 10.1534/genetics.112.148213. Epub 2013 Feb 14. Genetics. 2013. PMID: 23410836 Free PMC article.
-
No evidence of Neandertal admixture in the mitochondrial genomes of early European modern humans and contemporary Europeans.Am J Phys Anthropol. 2011 Oct;146(2):242-52. doi: 10.1002/ajpa.21569. Epub 2011 Aug 24. Am J Phys Anthropol. 2011. PMID: 21913172
-
The evolutionary history of human populations in Europe.Curr Opin Genet Dev. 2018 Dec;53:21-27. doi: 10.1016/j.gde.2018.06.007. Epub 2018 Jun 28. Curr Opin Genet Dev. 2018. PMID: 29960127 Review.
-
[Progresses on Neandertal genomics].Yi Chuan. 2012 Jun;34(6):659-65. doi: 10.3724/sp.j.1005.2012.00659. Yi Chuan. 2012. PMID: 22698735 Review. Chinese.
Cited by
-
The Strength of Selection against Neanderthal Introgression.PLoS Genet. 2016 Nov 8;12(11):e1006340. doi: 10.1371/journal.pgen.1006340. eCollection 2016 Nov. PLoS Genet. 2016. PMID: 27824859 Free PMC article.
-
Midfacial Morphology and Neandertal-Modern Human Interbreeding.Biology (Basel). 2022 Aug 3;11(8):1163. doi: 10.3390/biology11081163. Biology (Basel). 2022. PMID: 36009790 Free PMC article.
-
More than a decade of genetic research on the Denisovans.Nat Rev Genet. 2024 Feb;25(2):83-103. doi: 10.1038/s41576-023-00643-4. Epub 2023 Sep 18. Nat Rev Genet. 2024. PMID: 37723347 Review.
-
Underrepresented Populations at the Archaic Introgression Frontier.Front Genet. 2022 Feb 25;13:821170. doi: 10.3389/fgene.2022.821170. eCollection 2022. Front Genet. 2022. PMID: 35281795 Free PMC article. No abstract available.
-
The Impact of Early Human Migration on Brown Adipose Tissue Evolution and Its Relevance to the Modern Obesity Pandemic.J Endocr Soc. 2018 Dec 18;3(2):372-386. doi: 10.1210/js.2018-00363. eCollection 2019 Feb 1. J Endocr Soc. 2018. PMID: 30723844 Free PMC article. Review.
References
-
- Vernot B., Akey J.M. Resurrecting surviving Neandertal lineages from modern human genomes. Science. 2014;343:1017–1021. - PubMed
Publication types
MeSH terms
Grants and funding
LinkOut - more resources
Full Text Sources
Other Literature Sources
