

Point-of-care end-tidal carbon monoxide reflects severity of hemolysis in sickle cell anemia
- PMID: 25683629
- PMCID: PMC4376621
- DOI: 10.1002/pbc.25447
Point-of-care end-tidal carbon monoxide reflects severity of hemolysis in sickle cell anemia
Abstract
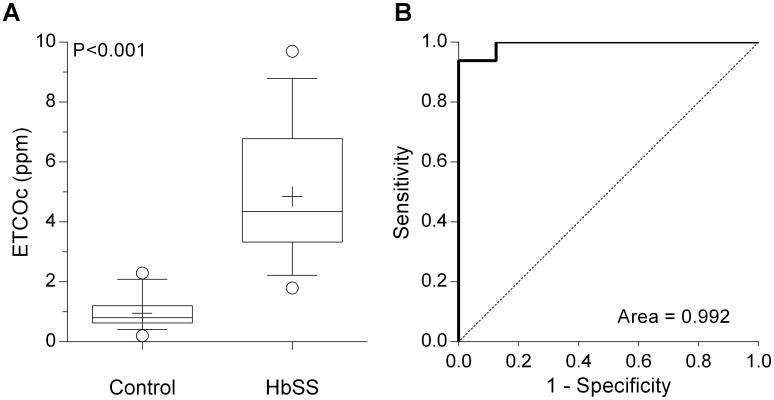
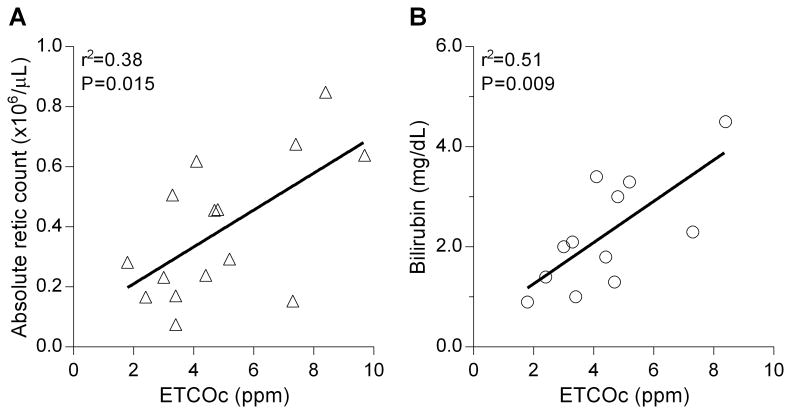
Carbon monoxide (CO) production from heme catabolism is increased with hemolysis. A portable end-tidal CO (ETCO) monitor was used to analyze breath samples in 16 children with sickle cell anemia (SCA, 5-14 years). Median (range) ETCO for SCA was 4.35 ppm (1.8-9.7) versus 0.80 ppm (0.2-2.3) for controls (P < 0.001). ETCOc >2.1 ppm provided sensitivity and specificity of 93.8% (69.8-99.8%) for detecting SCA. ETCO correlated with reticulocytosis (P = 0.015) and bilirubin (P = 0.009), and was 32% lower in children receiving hydroxyurea (P = 0.09). Point-of-care ETCO analysis may prove useful for non-invasive monitoring of hemolysis and as a screening test for SCA.
Keywords: hemoglobinopathies; red blood cell disorders; sickle cell anemia.
© 2015 Wiley Periodicals, Inc.
Conflict of interest statement
Figures
References
-
- Owens EO. Endogenous carbon monoxide production in disease. Clin Biochem. 2010;43:1183–1188. - PubMed
-
- Gozzelino R, Jeney V, Soares MP. Mechanisms of cell protection by heme oxygenase-1. Annu Rev Pharmacol Toxicol. 2010;50:323–354. - PubMed
-
- James EB, Vreman HJ, Wong RJ, Stevenson DK, Vichinsky E, Schumacher L, Hall JY, Simon J, Golden DW, Harmatz P. Elevated exhaled carbon monoxide concentration in hemoglobinopathies and its relation to red blood cell transfusion therapy. Pediatr Hematol Oncol. 2010;27:112–121. - PubMed
Publication types
MeSH terms
Substances
Grants and funding
LinkOut - more resources
Full Text Sources
Other Literature Sources
Medical
