. 2015 Feb 17;10(6):873-882.
doi: 10.1016/j.celrep.2015.01.032. Epub 2015 Feb 13.

Spontaneous Neurotransmitter Release Shapes Dendritic Arbors via Long-Range Activation of NMDA Receptors

Affiliations

Spontaneous Neurotransmitter Release Shapes Dendritic Arbors via Long-Range Activation of NMDA Receptors

Laura C Andreae et al. Cell Rep. .

Abstract

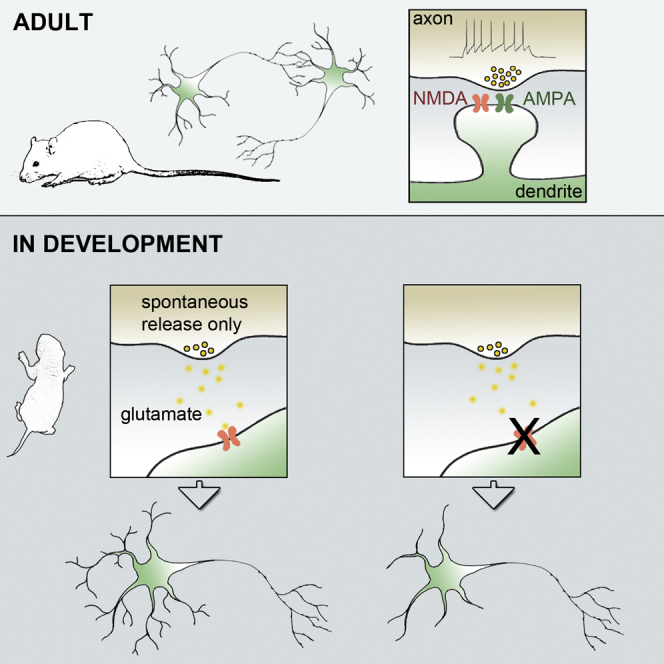
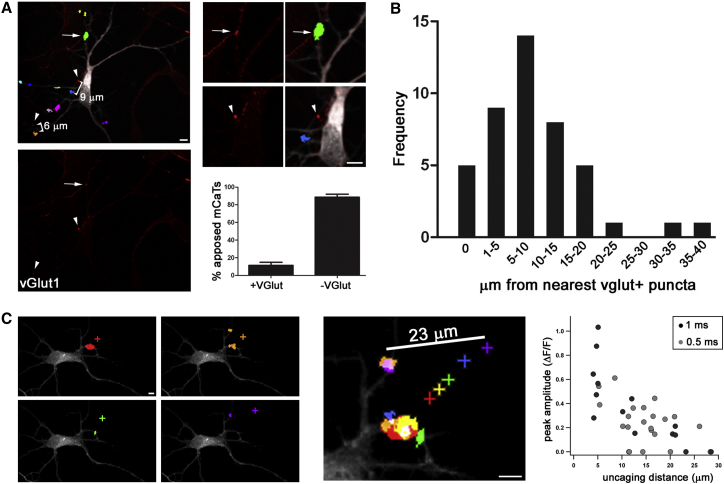
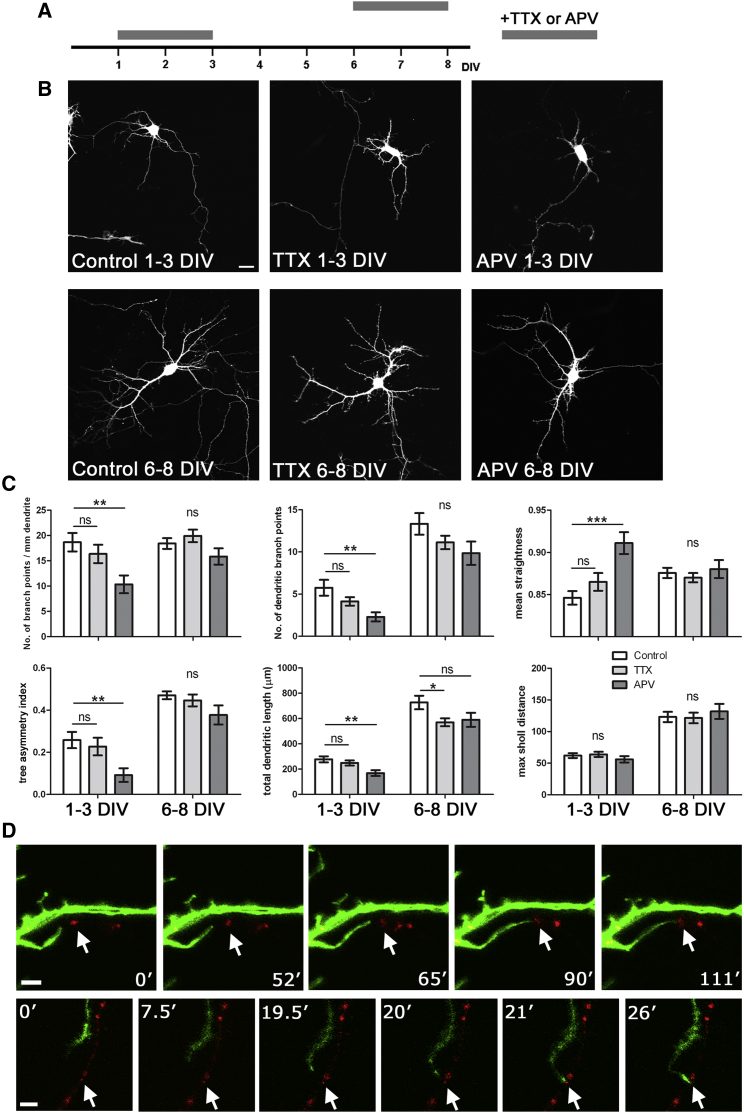
Spontaneous neurotransmitter release is a core element of synaptic communication in mature neurons, but despite exceptionally high levels of spontaneous vesicle cycling occurring in developing axons, little is known of its function during this period. We now show that high-level, spontaneous axonal release of the neurotransmitter glutamate can signal at long range to NMDA receptors on developing dendrites, prior to synapse formation and, indeed, axodendritic contact. Blockade of NMDA signaling during this early period of spontaneous vesicle cycling leads to a reduction in dendritic arbor complexity, indicating an important role for early spontaneous release in dendritic arbor growth.


Figures

None
Graphical abstract
Figure 1
Figure 1
Immature Neurons Show Spontaneous NMDA-Dependent Events (A) Biosyn labeling of spontaneously cycling VAMP2+ vesicles (spon) colocalizes with vGlut1 staining at 4 DIV. (B) Focal glutamate uncaging (+ on image) induces a robust localized calcium transient in a 4 DIV dendrite expressing GCaMP3 in 0 Mg2+ (top, “Blue Orange icb” lookup table, ImageJ). This transient is abolished by application of APV (50 μM, bottom). (C) Example of spontaneous mCaTs in a single neuron imaged over 300 s. Tracings obtained in NeuronJ are overlaid in green with example responses superimposed (numbered 1–4). Tracings were concatenated to obtain kymographs showing normalized fluorescence for all dendrites as a function of time (see Experimental Procedures). Example mCaTs are indicated by arrows, with corresponding ΔF/F traces shown to the left; all are abolished by APV. (D) Quantification shows that spontaneous mCaTs at 4–5 DIV are reduced by APV (∗∗p < 0.01, n = 10 cells). (E) Electrophysiological recordings at 4–5 DIV demonstrate spontaneous NMDA mEPSCs, which are abolished by APV (p < 0.05, n = 7). Error bars represent SEM. Scale bars are 5 μm. See also Figure S1.
Figure 2
Figure 2
Spontaneous NMDA-Dependent mCaTs in Immature Hippocampal Slices (A) 3D projection of example region of P4 hippocampal slice showing neurons infected with AAV-GCaMP5, axes in microns. (B) Two example mCaT responses: locations indicated (orange and pink) with time-lapse images of site 1 below, showing the frame before peak response, peak, and 740 ms after peak. Corresponding ΔF/F traces (1 and 2) to the right. (C) Quantification shows that spontaneous mCaT frequency at P3–P4 is reduced by APV (p < 0.05, n = 5 cells). Error bars represent SEM. Scale bar 5 μm.
Figure 3
Figure 3
Spontaneous mCaTs Inhibited by Glutamate Scavenger and Triggered by Sucrose-Induced Vesicular Release (A) Schematic depicting action of the enzyme GPT, which in the presence of pyruvate converts glutamate to alanine and α-ketoglutarate. (B) Calibration of GPT effect using focal uncaging (+ on image) and fluorescent traces from the region of interest (red box) shown at right. Black arrow indicates time of uncaging. A 1-ms uncaging pulse induces a calcium response that is abolished by 20 U/ml GPT+ 6 mM pyruvate (top traces). Increasing the glutamate pulse to 5 ms, but not 2 ms, can overcome the action of the enzyme while all responses are abolished by the addition of APV (bottom traces). (C) Example neuron with kymographs showing spontaneous mCaTs (example traces in black), which are significantly reduced following application of 20 U/ml GPT (+pyruvate) (remaining event in red). Quantification shows the number of responding regions before and after pyruvate control (left, n = 3 cells) or GPT (right, p < 0.01, n = 4). (D) Hypertonic sucrose application (arrow) induces a dramatic increase in mCaT frequency. The example neuron at the left shows mCaT locations in random colors, example kymographs shown in center, quantification of sucrose effect and example mCaT traces (n = 5) at right. Error bars represent SEM; scale bar is 5 μm. See also Figure S2.
Figure 4
Figure 4
Glutamate Release May Act at Long-Range Early in Development (A) Post hoc immunostaining with vGlut1 overlaid onto mCaT responses indicates that many response sites are localized at a distance from the nearest glutamate source. (Left) Example neuron with vGlut1 staining only below, and mCaTs identified using automated software and pseudocolored in random colors. The arrows indicate sites of apposed vGlut1 puncta and mCaT response (high magnification: right, top). Arrowheads show vGlut1 puncta located at the distance indicated from mCaT (right, center). (Below) Graph shows percentage of mCaTs that abut a glutamate release site. (B) Distribution of distances between mCaT response site and nearest vGlut1. (C) Distance mapping using focal glutamate uncaging. (Left) Individual examples of uncaging responses. (Center) Overlay of all uncaging events (color coded). (Right) Peak ΔF/F as a function of uncaging distance. Error bars represent SEM. Scale bars are 5 μm.
Figure 5
Figure 5
Spontaneous Glutamate Release Directs Dendritic Arbor Complexity (A) Schematic showing TTX or APV treatment timelines. (B) Representative images of neurons transfected with GFP and treated with TTX or APV at the times shown; scale bar represents 20 μm. (C) Quantification of dendritic arbor parameters: branch point density, number of branch points, dendritic straightness, tree asymmetry index (where 0 = symmetrical, 1 = asymmetrical), total dendritic length, and maximal sholl distance in control (white, n ≥ 21 cells), TTX-treated (light gray, n ≥ 23 cells), and APV-treated (dark gray, n ≥ 20 cells) neurons. (D) Dual-color imaging of two neurons, dendrites of one expressing GFP (green), and axonal synaptic vesicle clusters expressing tagged VAMP2 (red). Stills from movies with time in minutes indicated; scale bar represents 5 μm. Arrow indicates “target” vesicle cluster. Error bars represent SEM. See also Figure S3.

Similar articles

Cited by

References

    1. Akashi K., Kakizaki T., Kamiya H., Fukaya M., Yamasaki M., Abe M., Natsume R., Watanabe M., Sakimura K. NMDA receptor GluN2B (GluR epsilon 2/NR2B) subunit is crucial for channel function, postsynaptic macromolecular organization, and actin cytoskeleton at hippocampal CA3 synapses. J. Neurosci. 2009;29:10869–10882. - PMC - PubMed
    1. Allène C., Cattani A., Ackman J.B., Bonifazi P., Aniksztejn L., Ben-Ari Y., Cossart R. Sequential generation of two distinct synapse-driven network patterns in developing neocortex. J. Neurosci. 2008;28:12851–12863. - PMC - PubMed
    1. Andreae L.C., Burrone J. The role of neuronal activity and transmitter release on synapse formation. Curr. Opin. Neurobiol. 2014;27:47–52. - PMC - PubMed
    1. Andreae L.C., Fredj N.B., Burrone J. Independent vesicle pools underlie different modes of release during neuronal development. J. Neurosci. 2012;32:1867–1874. - PMC - PubMed
    1. Balu D.T., Basu A.C., Corradi J.P., Cacace A.M., Coyle J.T. The NMDA receptor co-agonists, D-serine and glycine, regulate neuronal dendritic architecture in the somatosensory cortex. Neurobiol. Dis. 2012;45:671–682. - PMC - PubMed