. 2015 Feb 17;10(6):891-899.
doi: 10.1016/j.celrep.2015.01.020. Epub 2015 Feb 13.

HIGD1A Regulates Oxygen Consumption, ROS Production, and AMPK Activity during Glucose Deprivation to Modulate Cell Survival and Tumor Growth

Affiliations

HIGD1A Regulates Oxygen Consumption, ROS Production, and AMPK Activity during Glucose Deprivation to Modulate Cell Survival and Tumor Growth

Kurosh Ameri et al. Cell Rep. .

Abstract

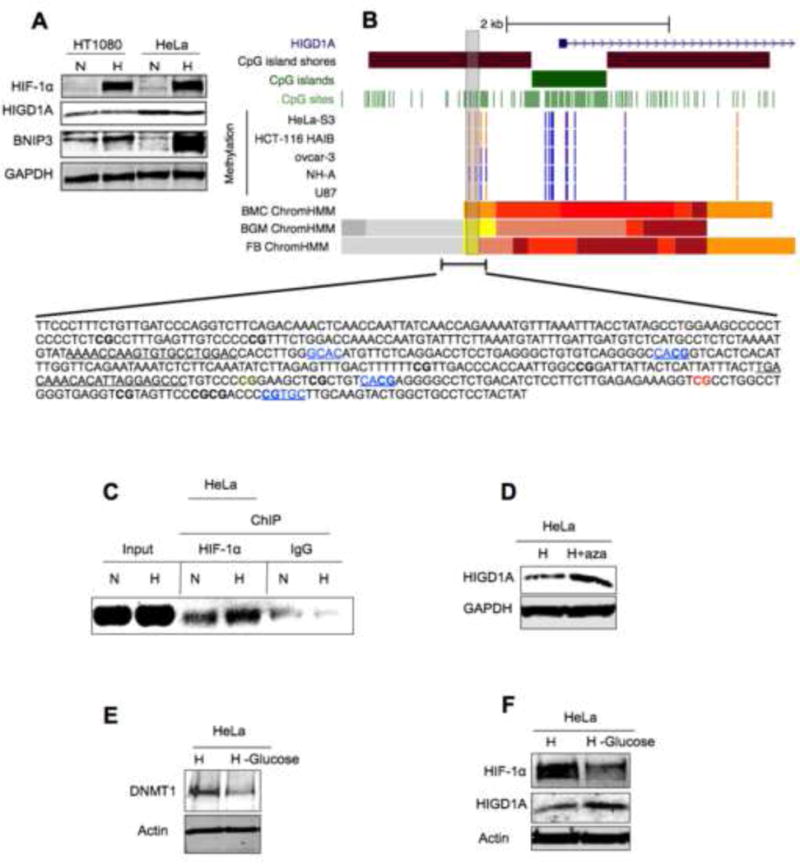
Hypoxia-inducible gene domain family member 1A (HIGD1A) is a survival factor induced by hypoxia-inducible factor 1 (HIF-1). HIF-1 regulates many responses to oxygen deprivation, but viable cells within hypoxic perinecrotic solid tumor regions frequently lack HIF-1α. HIGD1A is induced in these HIF-deficient extreme environments and interacts with the mitochondrial electron transport chain to repress oxygen consumption, enhance AMPK activity, and lower cellular ROS levels. Importantly, HIGD1A decreases tumor growth but promotes tumor cell survival in vivo. The human Higd1a gene is located on chromosome 3p22.1, where many tumor suppressor genes reside. Consistent with this, the Higd1a gene promoter is differentially methylated in human cancers, preventing its hypoxic induction. However, when hypoxic tumor cells are confronted with glucose deprivation, DNA methyltransferase activity is inhibited, enabling HIGD1A expression, metabolic adaptation, and possible dormancy induction. Our findings therefore reveal important new roles for this family of mitochondrial proteins in cancer biology.


Figures

Figure 1
Figure 1. HIGD1A protects against glucose starvation and suppresses tumor growth with diminished apoptosis
(Ai) Immunoblot analysis of HIGD1A levels following shRNA-mediated knockdown in wt MEFs (control shRNA=ctrl). (A ii and iii) Phase contrast microscopy as well as trypan blue exclusion count indicate that HIGD1A is necessary for survival of cells during glucose starvation/hypoxia. 20,000 cells were seeded in 6-well plates and counted after 4 days. (Bi) Immunoblot analysis comparing protein levels of HIGD1A in HIF-deficient (Hif-1α−/−) MEFs stably expressing HIGD1A versus wild-type MEFs (Hif-1α+/+) exposed to hypoxia. (Bii) Colony formation assays showing that HIGD1A expression in HIF-deficient (Hif-1α−/−) MEFs results in fewer as well as smaller colonies during combined hypoxia/glucose deprivation or glucose deprivation alone. (C) Viability assay of Hif-1α−/− MEFs expressing HIGD1A compared with control GFP cells following three days of glucose deprivation. (D) Hif-1α−/− MEFs stably expressing HIGD1A resulted in significantly smaller tumor xenografts when grown for 3 weeks subcutaneously in mice. (Ei) Histopathological analysis indicating lack of necrosis in Hif-1α−/− HIGD1A tumors, but profound necrosis in Hif-1α−/− GFP control tumors. Cleaved-caspase-3 immunohistochemical staining shows significantly more apoptosis in Hif-1α−/− GFP control tumors (Eii). Error bars represent ±SD. * p<0.05. Five mice per group were used for tumor growth and analysis.
Figure 2
Figure 2. HIGD1A can regulate mitochondrial superoxide and oxygen consumption during glucose starvation
(A) Immunoprecipitation assay showing HIGD1A can interact with complex III subunit 2 of the respiratory chain. (B) FACS analysis showing that HIF-deficient cells overexpressing HIGD1A have increased mitochondrial ROS (superoxide) during glucose starvation compared to control cells overexpressing GFP. (Ci and Cii) Oxygen consumption is lower during glucose deprivation when HIGD1A is overexpressed in Hif-1α−/− cells. (Di and Dii) When glucose is re-introduced to glucose-starved cells, HIGD1A expressing cells increase their oxygen consumption at a faster rate than control GFP expressing cells. Error bars represent ±SD, * p<0.05.
Figure 3
Figure 3. Expression and regulation of HIGD1A in cancer
(A) Immunoblot analysis of HIGD1A, HIF1α and BNIP3 expression in human HT1080 and HeLa cancer cell lines during normoxia or hypoxia (B) Data from Illumina HumanMethylation450 methylation array, and the ENCODE consortium showing high methylation level (vertical orange lines) upstream of the 5′ CpG island promoter, in a CpG island “shore.” The HIGD1A CpG island itself is generally unmethylated (vertical blue and violet lines) in both cancer cell lines (U87, ovcar-3, HCT-116, HeLa) as well as in normal human astrocytes (NH-A). Two of the CpGs (within vertical grey rectangle) in the 5′ shore of that CpG island have high methylation levels in HeLa, ovcar-3, HCT-116, and U87 cell lines, and partial methylation in normal human astrocytes, indicating a potential differential methylated region (DMR, red and green CG in the sequence given). The sequence of the entire 5′ region (region chr3: 42846997–42847502) including the two specific CpGs (highlighted as green and red in the sequence) of this putative DMR neighbors several HRE-core sequences (blue underlined). ChIP-seq data from the Roadmap Epigenomics Project indicate that this region is marked by histone modifications associated with enhancers (yellow and orange bars) in both brain (FB ChromHMM, BGM ChromHMM) and breast (BMC ChromHMM). Primers used for CHIP analysis in black underlined. (C) ChIP analysis performed on normoxic (N) or hypoxic (H) HeLa cells using primers (black underlined in sequence) within the 5′ region that contains the two specific CpGs (highlighted as green and red in the sequence) of this putative DMR. (D) Immunoblot analysis demonstrating expression of HIGD1A protein in the human cervical cancer cell line HeLa in hypoxia (H) versus hypoxia combined with the DNA methylation inhibitor (DNMT-inhibitor) 5-aza-2′-deoxycytidine (H+aza). (E) Immunoblot analysis showing that glucose starvation (-glucose) during hypoxia (H) reduces expression of DNMT1. (F) Glucose starvation induces HIGD1A in hypoxic HeLa cells. H=hypoxia (1% O2)
Figure 4
Figure 4. Expression of HIGD1A in vivo and in circulating tumor cells
(A) Pimonidazole and HIF1α staining of MDA-MB 231 xenografts showing diminished expression of HIF1α within perinecrotic regions where pimonidazole staining is strongest. (B) MDA-MB 231 xenografts showing enhanced expression of HIGD1A at perinecrotic regions where HIF1α expression is diminished. (C) Immunoblot analysis showing that expression of DNMT1 during hypoxia (H) versus hypoxia and glucose starvation (H -Glucose). (D) Glucose starvation during hypoxia enhances HIGD1A protein level in MDA-MB 231 cells. (E) Immunoblot analysis of HIGD1A expression in MDA-MB231 cells from which the xenografts where made, and in CTCs derived from the xenografts via blood extraction, as a function of oxygen. (F) Human primary glioblastoma biopsies demonstrate lack of HIGD1A induction in hypoxic regions where Ca9 induction is evident. Induction of HIGD1A is evident only after treatment with the anti-angiogenesis agent bevacizumab. N=normoxia (21% oxygen), H=hypoxia (1% oxygen), HBS=HIF binding site, HRE=hypoxia response element, CTC=circulating tumor cell.

Similar articles

Cited by

References

    1. Ameri K, Luong R, Zhang H, Powell AA, Montgomery KD, Espinosa I, Bouley DM, Harris AL, Jeffrey SS. Circulating tumour cells demonstrate an altered response to hypoxia and an aggressive phenotype. Br J Cancer. 2010;102:561–569. - PMC - PubMed
    1. Ameri K, Rajah AM, Nguyen V, Sanders TA, Jahangiri A, Delay M, Donne M, Choi HJ, Tormos KV, Yeghiazarians Y, et al. Nuclear localization of the mitochondrial factor HIGD1A during metabolic stress. PLoS One. 2013;8:e62758. - PMC - PubMed
    1. Arai R, Ueda H, Kitayama A, Kamiya N, Nagamune T. Design of the linkers which effectively separate domains of a bifunctional fusion protein. Protein Eng. 2001;14:529–532. - PubMed
    1. Bhat Singh R, Amare Kadam PS. Investigation of tumor suppressor genes apart from VHL on 3p by deletion mapping in sporadic clear cell renal cell carcinoma (cRCC) Urol Oncol 2013 - PubMed
    1. Bragado P, Sosa MS, Keely P, Condeelis J, Aguirre-Ghiso JA. Microenvironments dictating tumor cell dormancy. Recent Results Cancer Res. 2012;195:25–39. - PMC - PubMed