. 2015 May;27(5):908-22.
doi: 10.1016/j.cellsig.2015.02.003. Epub 2015 Feb 12.

UCR1C is a novel activator of phosphodiesterase 4 (PDE4) long isoforms and attenuates cardiomyocyte hypertrophy

Affiliations

UCR1C is a novel activator of phosphodiesterase 4 (PDE4) long isoforms and attenuates cardiomyocyte hypertrophy

Li Wang et al. Cell Signal. 2015 May.

Abstract

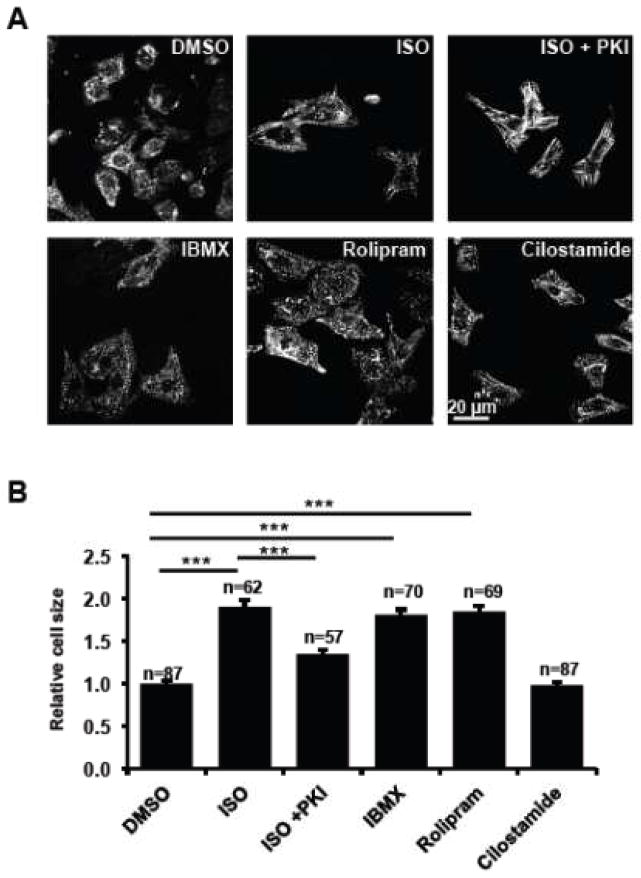
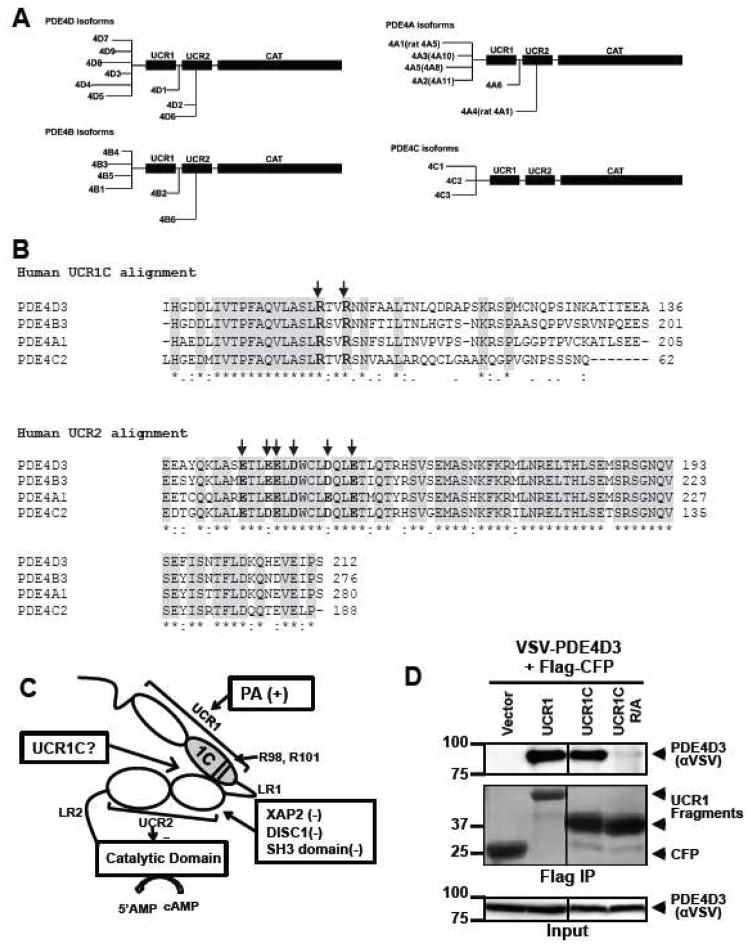
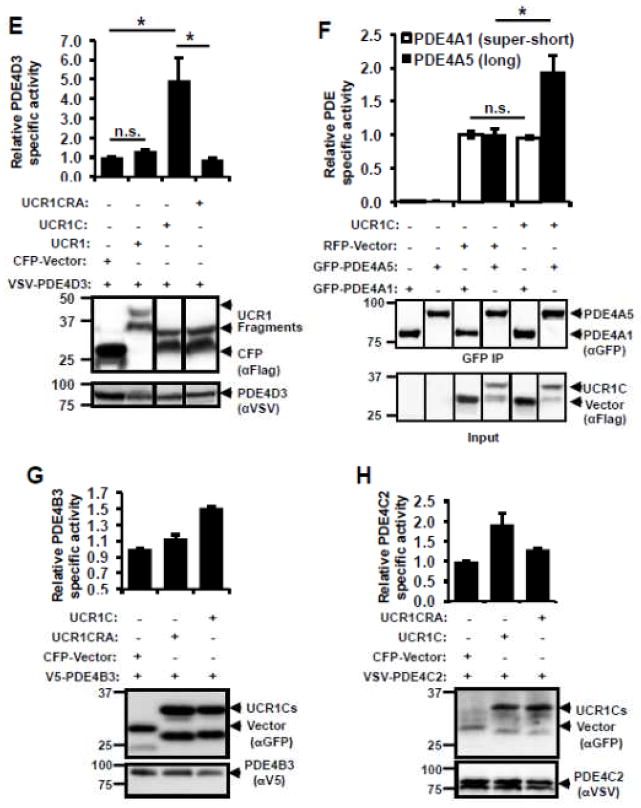
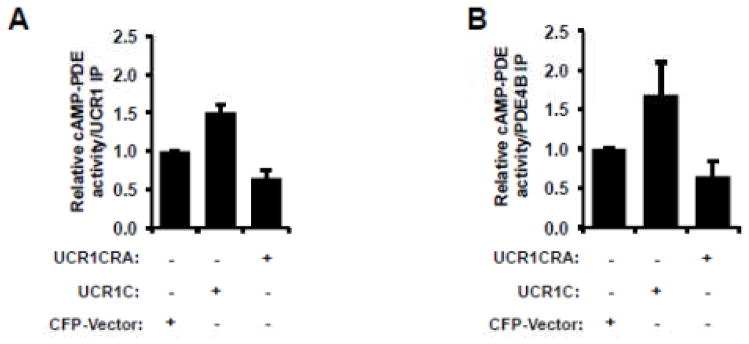
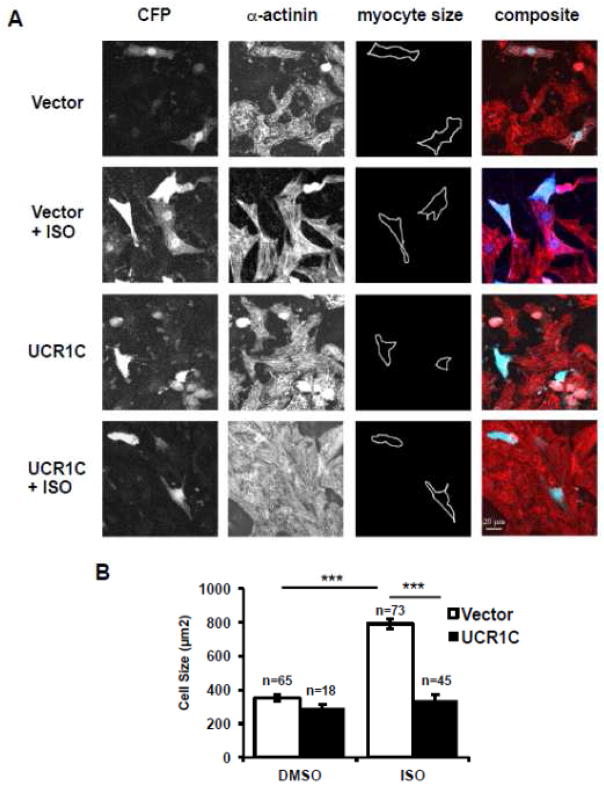
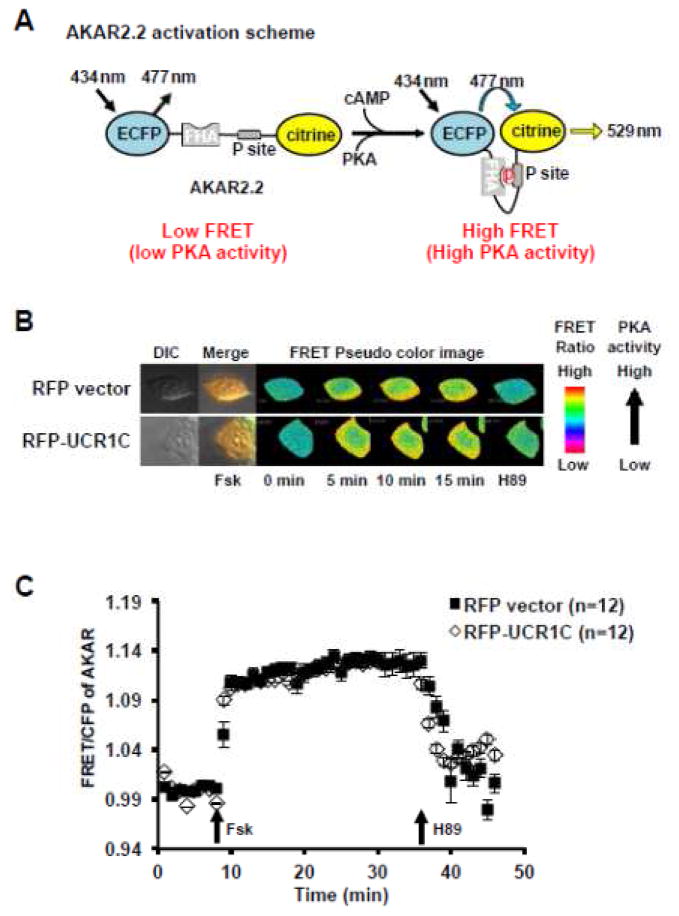
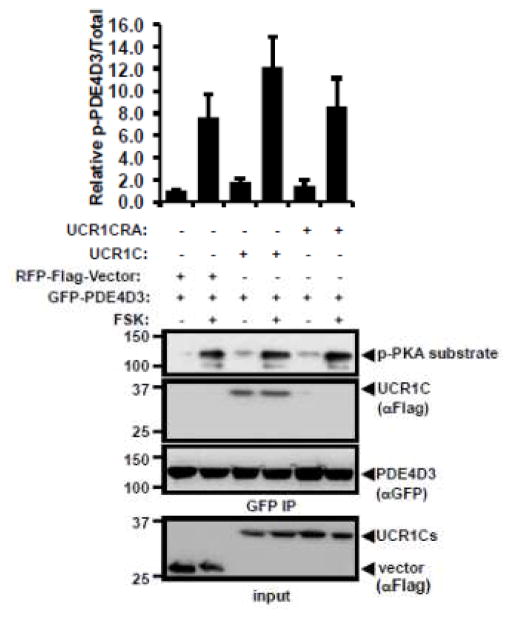
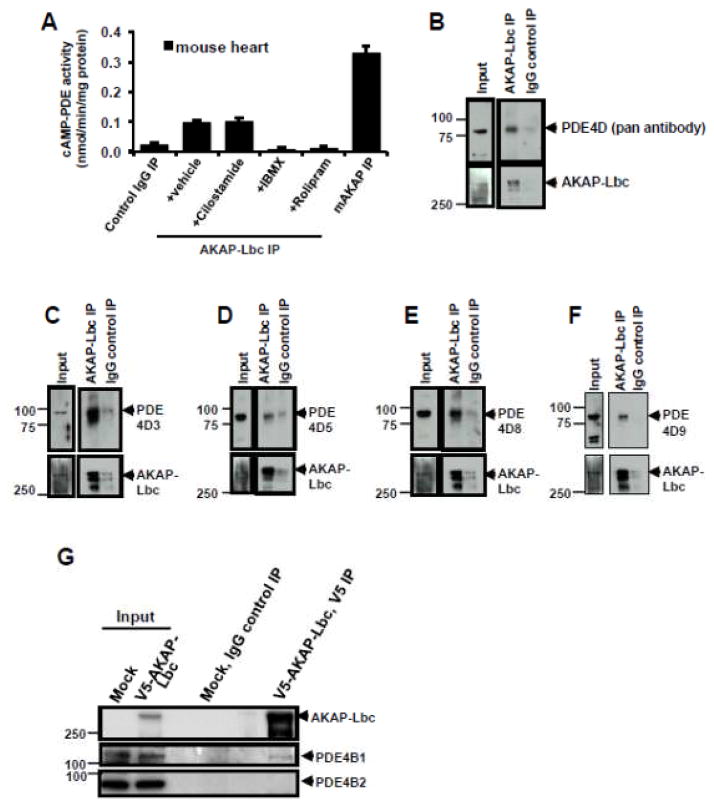
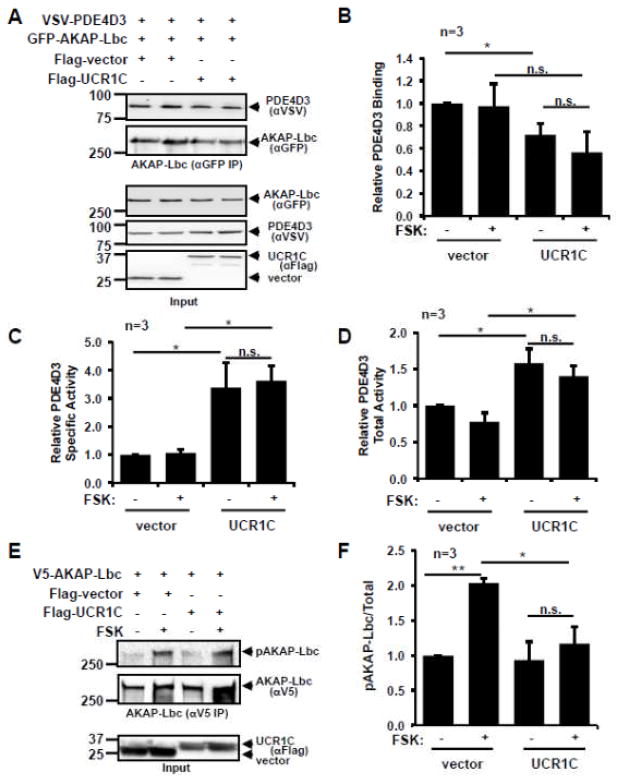
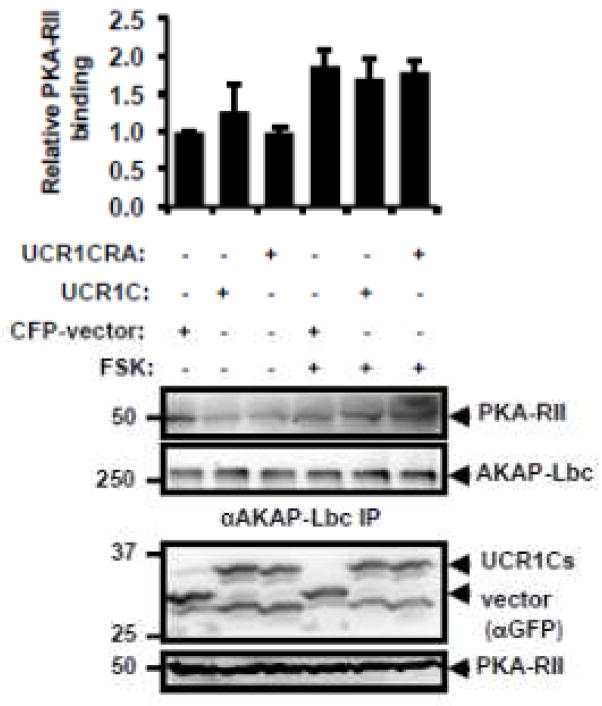
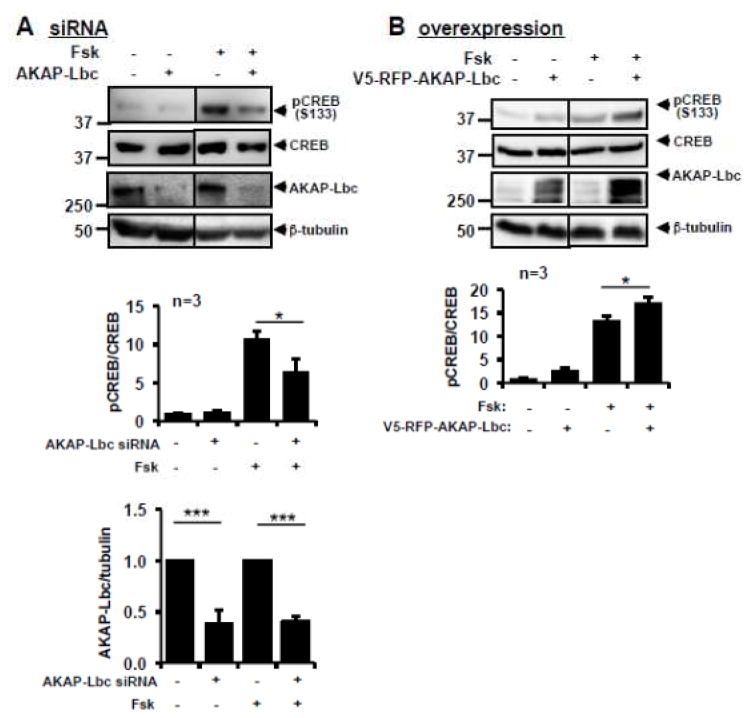
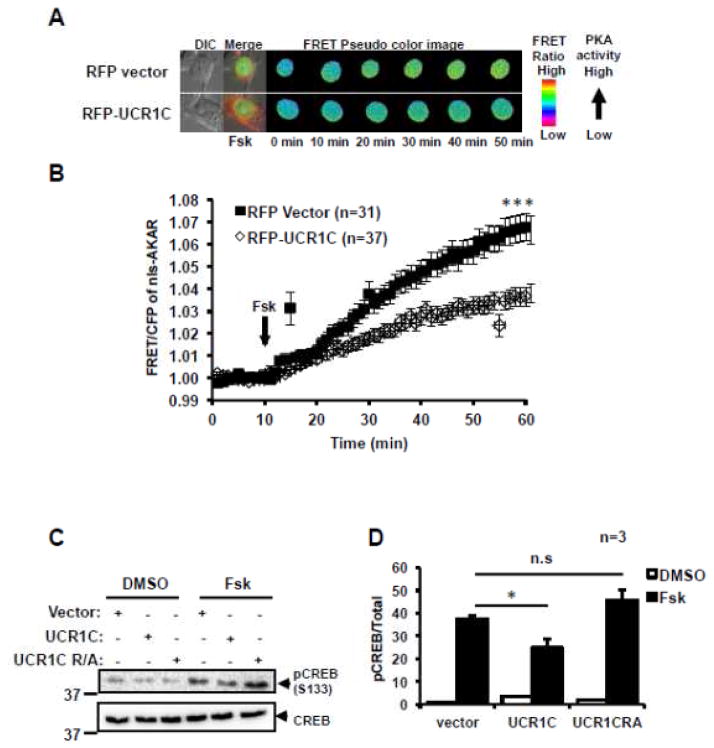
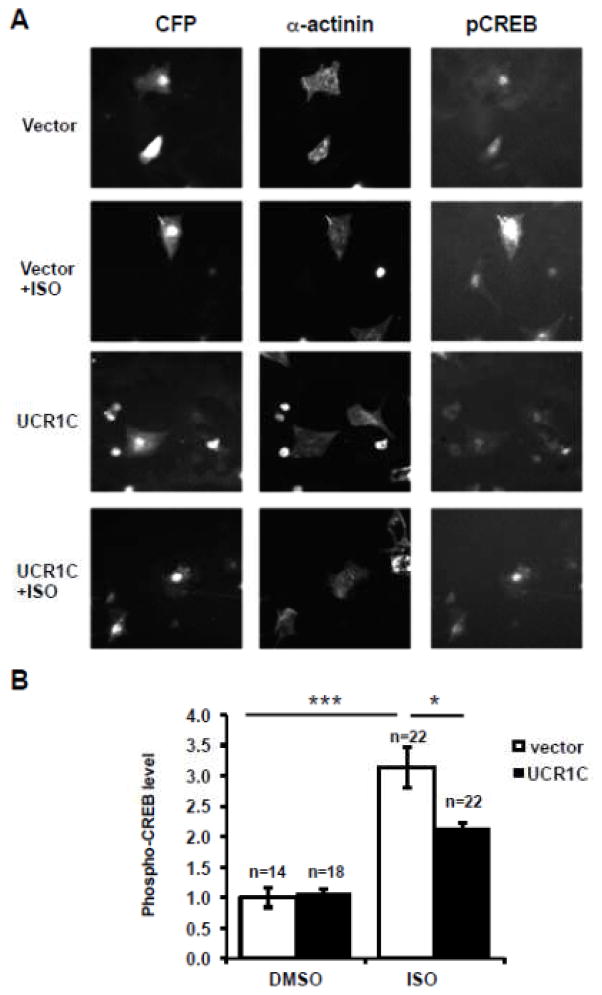
Hypertrophy increases the risk of heart failure and arrhythmia. Prevention or reversal of the maladaptive hypertrophic phenotype has thus been proposed to treat heart failure. Chronic β-adrenergic receptor (β-AR) stimulation induces cardiomyocyte hypertrophy by elevating 3',5'-cyclic adenosine monophosphate (cAMP) levels and activating downstream effectors such protein kinase A (PKA). Conversely, hydrolysis of cAMP by phosphodiesterases (PDEs) spatiotemporally restricts cAMP signaling. Here, we demonstrate that PDE4, but not PDE3, is critical in regulating cardiomyocyte hypertrophy, and may represent a potential target for preventing maladaptive hypertrophy. We identify a sequence within the upstream conserved region 1 of PDE4D, termed UCR1C, as a novel activator of PDE4 long isoforms. UCR1C activates PDE4 in complex with A-kinase anchoring protein (AKAP)-Lbc resulting in decreased PKA signaling facilitated by AKAP-Lbc. Expression of UCR1C in cardiomyocytes inhibits hypertrophy in response to chronic β-AR stimulation. This effect is partially due to inhibition of nuclear PKA activity, which decreases phosphorylation of the transcription factor cAMP response element-binding protein (CREB). In conclusion, PDE4 activation by UCR1C attenuates cardiomyocyte hypertrophy by specifically inhibiting nuclear PKA activity.

Keywords: 3′,5′-cyclic monophosphate (cAMP); A-kinase anchoring protein (AKAP); Compartmentalized signaling; Phosphodiesterase 4 (PDE4) activation; cardiomyocyte hypertrophy; protein kinase A (PKA).


Conflict of interest statement

Conflict of interests

None declared

Figures

Figure 1
Figure 1. PDE4 but not PDE3 actively prevents hypertrophy
Freshly isolated NRVMs were treated with PDE inhibitors [a general PDE inhibitor IBMX (10 μM), a specific PDE4 inhibitor rolipram (7.5 μM), and a specific PDE3 inhibitor cilostamide (1 μM)], vehicle control DMSO, a β-AR agonist ISO (10 μM), and ISO plus a cell permeable PKA inhibitor PKI (1 μM). After 48 hours treatment, cells were fixed, permeabilized, and immunostained for the cardiomyocyte marker α-actinin. Representative images are shown in 1A. The sizes of NRVMs were quantified using NIH Image J software and plotted in 1B. Data are expressed as mean ± s.e.m.; the number of cells counted is indicated. Student’s t-Tests were performed for statistical analysis. A p-value <0.001 was highly significant (***) while a p-value > 0.05 was not significant (n.s.).
Figure 2
Figure 2. Development of an activator of PDE4 long isoforms
(A) Schematic presentation of human PDE4 isoforms. As a note, rat long isoform PDE4A5 is the homolog of human PDE4A1, and rat super-short isoform PDE4A1 is the homolog of human PDE4A4. (B) UCR1C and UCR2 alignment in human PDE4 long isoforms. Arrow indicates the critical residues responsible for UCR1-UCR2 interaction. As a note, UCR1C and UCR2 are 100% conserved among different long isoforms from the same genes. Thus, representative long isoforms for each PDE4 genes (PDE4D3, PDE4B3, PDE4A1 and PDE4C2) were used for alignment. (C) Activation mode of PDE4 long isoforms: UCR1 binds UCR2 via electrostatic interactions between residues Arg98, and Arg101 of UCR1C and residues Glu146, Glu147, Asp149 of UCR2N in human PDE4D3. UCRs form a regulatory module, where UCR2 itself exerts an autoinhibitory effect on PDE activity. Phosphorylation as well as interaction of UCRs with lipids and proteins [PA/PS, XAP2, DISC1 and SH3 domains (Lyn and Fyn)] modulates PDE4 activity. Thus, we hypothesize that UCR1C (amino acids 81-136, in gray) binds and modulates PDE4 long isoforms. (D) Interaction of UCR1 and UCR1C with PDE4D3. HEK293T cells were co-transfected with VSV-PDE4D3 and FLAG-UCR1 expression constructs. Forty-eight hours later, cell lysates were harvested for immunoprecipitation (IP) with FLAG antibody. Ponceau S staining shows the successful IP (middle panels). UCR1C binding to PDE4D3 was determined by measuring the amount of VSV-PDE4D3 associated with the immunoprecipitants by Western blot. Both UCR1 (amino acids 17-136) and UCR1C bind PDE4D3. Double mutation of R98A and R101A (UCR1C R/A) abolished interaction. (E) UCR1C, but not UCR1C R/A, enhances activity of PDE4D3. Lysates from 2C were used for in vitro cAMP-PDE assay. Western blot analysis was performed to ensure equal expression of PDE4D3 and expressed of UCR1 mutants and control. The specific activity of PDE4D3 was calculated by normalizing the cAMP-PDE activity to PDE4D3 levels. (F) UCR1C activates long, but not short, PDE4A isoforms. HEK293T cells were co-transfected with GFP-tagged rat PDE4A isoforms and FLAG-UCR1C constructs. The long isoform GFP-PDE4A5 (homolog of human long isoform PDE4A1) and super short-isoform GFP-PDE4A1 (homolog of human super-short isoform PDE4A4) were immunoprecipitated then subjected to in vitro PDE assays and Western analysis. Specific activity was calculated from the cAMP-PDE assay normalized to GFP-PDE4A levels. Expression of UCR1C and its vector control were also shown for similar expression. InStat was used to perform for statistical analysis. A p-value < 0.05 was significant (*) while a p-value > 0.05 was not significant (n.s.). (G–H) UCR1C activates long PDE4B and PDE4C isoforms. HEK293T cells were co-transfected with FLAG-UCR1C constructs and V5-tagged human PDE4B3 (G) or VSV-tagged human PDE4C2 isoforms (H) respectively. The transfected lysates were used for in vitro PDE assays and Western analysis. Specific activity was calculated from the cAMP-PDE assay normalized to PDE4B3 or PDE4C2 respectively. Data represent the mean± s.e.m from 2 independent experiments.
Figure 3
Figure 3. UCR1C activates endogenous PDE4 long isoforms
HEK293T cells were transfected with cerulean-vector, cerulean-UCR1C, or cerulean-UCR1C R/A. Forty-eight hours later, cell lysates were harvested, and 1.5 mg total protein was applied for immunoprecipitation using protein A-agarose beads, and anti-PDE4B pan-antibody or anti-UCR1 antibody. Relative PDE activities of endogenous PDE4 long isoforms (anti-UCR1 IP) are shown in (A), and endogenous PDE4B (anti-PDE4B IP) in (B). The data were shown as mean± s.e.m from two independent experiments.
Figure 4
Figure 4. UCR1C prevents ISO-induced cardiomyocyte hypertrophy
UCR1C inhibits ISO-induced cardiomyocyte hypertrophy. NRVMs were transfected with Cerulean-UCR1C or Cerulean control vector then treated with ISO for 48 hours to induce hypertrophy. Cells were fixed, permeabilized, and stained with α-actinin (Red) for cell imaging. Representative images are shown in 4A. Cardiomyocytes with both α-actinin staining and Cerulean expression were selected for cell size measurements. The quantified results are shown in 4B. Data are expressed as mean ± s.e.m. The number of cells counted is indicated. Differences in quantitative variables were examined by one-way analysis of variance (ANOVA). A p-value < 0.001 was considered extremely significant (***) and < 0.05 was significant (*).
Figure 5
Figure 5. UCR1C does not alter global PKA activity
(A) Diagram of A kinase activity reporter (AKAR2.2), adapted from [64]. In AKAR2.2, PKA phosphorylation of the P sites results in binding to FHA, which induces the proximity of CFP and citrine to increase the FRET ratio. AKAR2.2 was used to report the overall PKA activity inside cells. HEK293T cells were co-transfected with AKAR2.2 and RFP-tagged UCR1C or RFP control plasmid. Twenty-four hours later, cells were plated on slides and imaged after another 24 hours. (B) Representative pseudo-color images of AKAR2.2 FRET ratio change in response to adenylyl cyclase activator Forskolin (20 μM) stimulation and subsequent PKA inhibition using H89 (20 μM). (C) Time-course of average AKAR FRET ratio. Cells with similar RFP expression intensity were selected for analysis. Data are expressed as mean ± s.e.m.. Black squares represent cells expressing RFP vector (n=12 cells), open diamonds represent cells expressing RFP-UCR1C (n=12 cells).
Figure 6
Figure 6. UCR1C does not modulate PKA-mediated PDE4D3 phosphorylation
HEK293T cells were co-transfected GFP-PDE4D3 with RFP-vector, RFP-UCR1C, or RFP-UCR1C R/A. 48 hours later, cells were treated with FSK or DMSO control, and cells lysates were harvested for PDE4D3 immunoprecipitation using protein A agarose beads and anti-GFP antibody. Western blot was then performed to investigate the phosphorylation level of PDE4D3. Image J quantification of two independent experiments on phosphor-PDE4D3/total were shown as mean± s.e.m.. Successful expression of UCR1C, UCR1C R/A mutants and vector in lysate and IP of PDE4D3 were also shown in the representative blot.
Figure 7
Figure 7. AKAP-Lbc interacts with PDE4 long isoforms
(A) AKAP-Lbc immune complex contained cAMP-PDE4 activity. AKAP-Lbc was immunoprecipitated from mouse heart extract (3 mg) and used to perform in vitro cAMP-PDE assay. Specific PDE inhibitors were used to identify PDE activity in the AKAP-Lbc complex. Prior to PDE assay, AKAP-Lbc immunoprecipitates were treated with a general PDE inhibitor IBMX, a specific PDE3 inhibitor cilostamide, or a specific PDE4 inhibitor rolipram. mAKAP immunoprecipitates were used as a positive control and IgG immunoprecipitates were used as a negative control. cAMP-PDE activities were displayed mean ± s.e.m. of three independent assays performed in triplicate. (B–F) Co-immunoprecipitation (co-IP) of endogenous PDE4D with AKAP-Lbc purified from mouse heart lysate. Endogenous AKAP-Lbc was immunoprecipitated from mouse heart lysate (2 mg). Control IgG IPs were performed using an equal amount of heart lysate, demonstrating the specific interaction of PDE4D with AKAP-Lbc. Western blots show identification of PDE4D (using a pan antibody that detects all family members, (B)), PDE4D3 (C), PDE4D5 (D), PDE4D8 (E) and PDE4D9 (F) that associate with AKAP-Lbc. (G) Endogenous PDE4B1 long isoform, but not short form PDE4B2, binds AKAP-Lbc. HEK293T cells were transfected with V5-AKAP-Lbc, 48 hrs later, cell lysates were prepared, and AKAP-Lbc was immunoprecipitated using V5-agarose beads. PDE4B1 and PDE4B2 were detected by immunoblotting using antibodies specific for either PDE4B1 or PDE4B2.
Figure 8
Figure 8. UCR1C augments PDE4 activity and inhibits PKA in the AKAP-Lbc complex
(A–D) HEK293T cells were co-transfected with GFP-AKAP-Lbc, VSV-PDE4D3 and RFP-UCR1C or RFP control vector. Forty-eight hours later, cells were treated with FSK (20 μM) or DMSO (vehicle control) for 20 minutes prior to AKAP-Lbc immunoprecipitation using GFP antibody. Samples were split in half for cAMP-PDE assays and Western blot analysis for quantification of protein levels. Representative Western blots are shown in 8A. Quantification of PDE4D3 binding to AKAP-Lbc by Image J is shown in 8B. Specific activity was calculated by normalizing PDE activities to levels of PDE4D3, and the result is shown in 8C. Total activity in AKAP-Lbc complex was calculated by dividing PDE activity to levels of AKAP-Lbc in IPs, and the result is shown in 8D. PDE activity is displayed mean ± s.e.m. from three independent experiments performed in triplicate. (E–F) UCR1C inhibits PKA-mediated AKAP-Lbc phosphorylation. HEK293T cells were co-transfected with V5-AKAP-Lbc and Cerulean-UCR1C or control vector. Forty-eight hours later, cells were treated with FSK, and then cell lysates were prepared and used for immunoprecipitation of AKAP-Lbc usingV5-agarose beads. PKA-mediated phosphorylation of AKAP-Lbc was measured by reactivity with an antibody to phospho-PKA substrates. Representative Western blot data are shown in 8E and quantification of results using Image J is shown in 8F as mean ± s.e.m.. InStat were performed for statistical analysis. A p-value < 0.05 was significant (*), a p-value < 0.01 was highly significant (**), while a p-value > 0.05 was not significant (n.s.).
Figure 9
Figure 9. UCR1C does not modulate AKAP-Lbc and PKA-RII interaction
HEK293T cells were transfected with cerulean-vector, cerulean-UCR1C, or cerulean-UCR1C R/A. After forty-eight hours, cells were treated with FSK or DMSO control, lysates were harvested, and equivalent amounts of protein were used for AKAP-Lbc immunoprecipitation using Protein A agarose beads and anti-AKAP-Lbc antibody (VO96). Western blot was then performed to determine binding of PKA-RII to AKAP-Lbc. Image J was used for quantification data from two independent experiments. Relative PKA-RII/AKAP-Lbc IP is shown as mean±s.e.m. Representative Western blot shows equivalent expression of UCR1C, UCR1C R/A mutants and vector in lysate, and equal immunoprecipitation of AKAP-Lbc.
Figure 10
Figure 10. AKAP-Lbc regulates PKA-mediated CREB phosphorylation
(A) AKAP-Lbc siRNA reduces PKA-mediated CREB phosphorylation. HEK293T cells were transfected with AKAP-Lbc siRNA or negative control siRNA. Seventy-two hours later, cells were treated with FSK, and cell lysates were harvested for Western blot. Representative Western blots, Image J quantification of AKAP-Lbc expression levels, and CREB phosphorylation level are shown. (B) AKAP-Lbc overexpression enhances PKA-mediated CREB phosphorylation. HEK293T cells were transfected with V5-RFP-AKAP-Lbc or control TagRFP. Forty-four hours later, cells were treated with FSK for 30 min, and cell lysates were harvested for Western blot. Representative blots, Image J quantification results of AKAP-Lbc expression level, and CREB phosphorylation level are shown. A p-value <0.05 was significant (*), and a p-value <0.001 was extremely significant (***).
Figure 11
Figure 11. UCR1C decreases nuclear PKA activity
AKAR was amended with a nuclear localization signal (nls-AKAR) to specifically report nuclear PKA activity in situ. (A) Representative pseudo-color images of nls-AKAR FRET change in response to FSK stimulation. (B) Time course of average nls-AKAR FRET ratio in response to FSK stimulation. Black squares represent cells expressing RFP vector control (n=31 cells), open diamonds represent cells expressing RFP-UCR1C (n=37 cells). UCR1C but not UCR1C R/A inhibits PKA-mediated CREB phosphorylation. (C) HEK293T cells expressing Cerulean-UCR1, Cerulean-UCR1C R/A, or Cerulean vector control were stimulated with FSK for 40 min, prior to SDS-PAGE and assessment of CREB phosphorylation at PKA substrate site Ser133. (D) Quantification of CREB phosphorylation level using Image J is shown as mean ± s.e.m. from 3 independent experiments. InStat were performed for statistical analysis. A p-value < 0.05 was significant (*), a p-value < 0.001 was extremely significant (***) while a p-value > 0.05 was not significant.
Figure 12
Figure 12. UCR1C expression in NRVMs decreases ISO-induced CREB phosphorylation
(A) Representative Image of ISO-induced CREB phosphorylation in NRVMs. NRVMs expressing Cerulean-UCR1C or Cerulean vector control were treated with ISO (10 μM for 30 min). NRVMs were then fixed and immunostained for the cardiomyocyte marker α-actinin (red) and phospho-CREB-Ser133 (green). (B) Quantification of CREB phosphorylation. Cerulean-positive and α-actinin–positive NRVMs were selected to determine phospho-CREB levels. Immunofluorescent signals were quantified using Metamorph Software. Results represent the average pCREB signal from the number of cells indicated in each condition shown as mean± s.e.m. A p-value < 0.001 were extremely significant (***), and a p-value < 0.05 were significant (*).

References

    1. Hill JA, Olson EN. The New England journal of medicine. 2008;358:1370–1380. - PubMed
    1. Selvetella G, Hirsch E, Notte A, Tarone G, Lembo G. Cardiovascular research. 2004;63:373–380. - PubMed
    1. Frey N, Katus HA, Olson EN, Hill JA. Circulation. 2004;109:1580–1589. - PubMed
    1. Frey N, Olson EN. Annual review of physiology. 2003;65:45–79. - PubMed
    1. Heineke J, Molkentin JD. Nature reviews Molecular cell biology. 2006;7:589–600. - PubMed

Publication types

MeSH terms