

Prenatal alcohol exposure alters steady-state and activated gene expression in the adult rat brain
- PMID: 25684047
- PMCID: PMC4833439
- DOI: 10.1111/acer.12622
Prenatal alcohol exposure alters steady-state and activated gene expression in the adult rat brain
Abstract
Background: Prenatal alcohol exposure (PAE) is associated with alterations in numerous physiological systems, including the stress and immune systems. We have previously shown that PAE increases the course and severity of arthritis in an adjuvant-induced arthritis (AA) model. While the molecular mechanisms underlying these effects are not fully known, changes in neural gene expression are emerging as important factors in the etiology of PAE effects. As the prefrontal cortex (PFC) and hippocampus (HPC) play key roles in neuroimmune function, PAE-induced alterations to their transcriptome may underlie abnormal steady-state functions and responses to immune challenge. This study examined brains from adult PAE and control females from our recent AA study to determine whether PAE causes long-term alterations in gene expression and whether these mediate the altered severity and course of arthritis in PAE females.
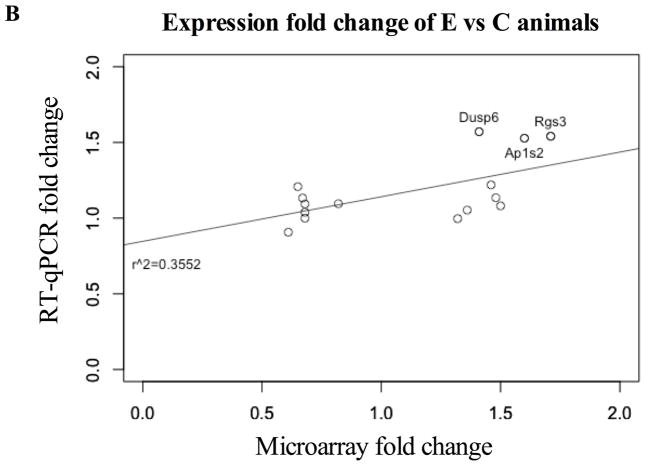
Methods: Adult females from PAE, pair-fed (PF), and ad libitum-fed control (C) groups were injected with either saline or complete Freund's adjuvant. Animals were terminated at the peak of inflammation or during resolution (Days 16 and 39 postinjection, respectively); cohorts of saline-injected PAE, PF, and C females were terminated in parallel. Gene expression was analyzed in the PFC and HPC using whole-genome mRNA expression microarrays.
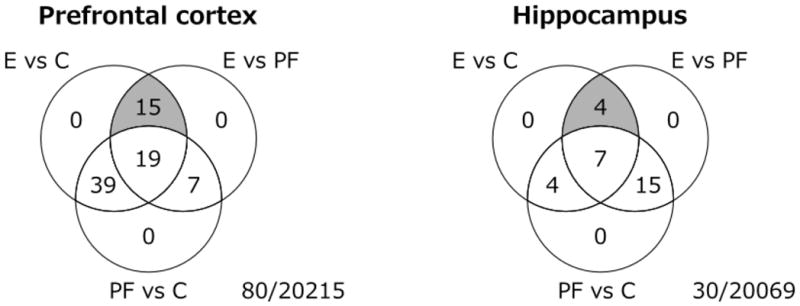
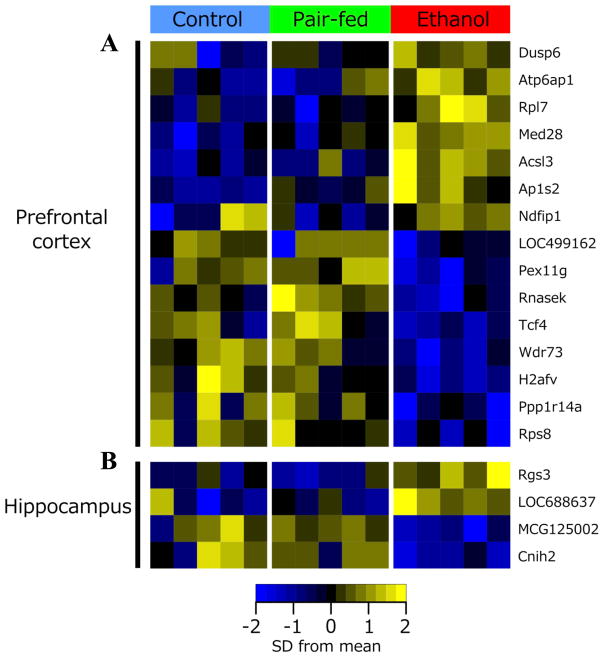
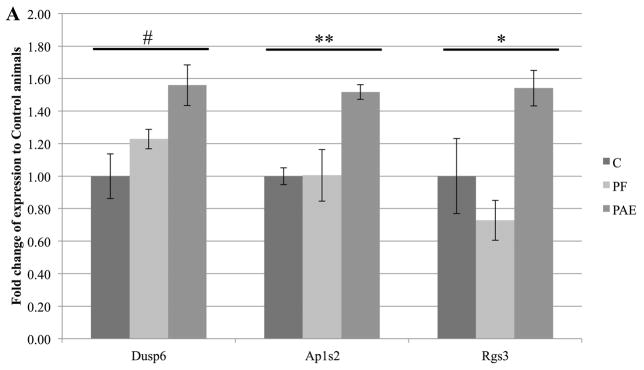
Results: Significant changes in gene expression in both the PFC and HPC were found in PAE compared to controls in response to ethanol exposure alone (saline-injected females), including genes involved in neurodevelopment, apoptosis, and energy metabolism. Moreover, in response to inflammation (adjuvant-injected females), PAE animals showed unique expression patterns, while failing to exhibit the activation of genes and regulators involved in the immune response observed in control and pair-fed animals.
Conclusions: These results support the hypothesis that PAE affects neuroimmune function at the level of gene expression, demonstrating long-term effects of PAE on the central nervous system response under steady-state conditions and following an inflammatory insult.
Keywords: Arthritis; Ethanol; Gene Expression; Inflammation; Prenatal Alcohol Exposure; Rat.
Copyright © 2015 by the Research Society on Alcoholism.
Figures
Comment in
-
Dissecting FASD through the global transcriptome.Alcohol Clin Exp Res. 2015 Mar;39(3):408-12. doi: 10.1111/acer.12655. Epub 2015 Feb 19. Alcohol Clin Exp Res. 2015. PMID: 25702586 Free PMC article.
Similar articles
-
Gene expression profiling reveals a lingering effect of prenatal alcohol exposure on inflammatory-related genes during adolescence and adulthood.Cytokine. 2020 Sep;133:155126. doi: 10.1016/j.cyto.2020.155126. Epub 2020 Jun 3. Cytokine. 2020. PMID: 32505093 Free PMC article.
-
Exposure to Chronic Mild Stress Differentially Alters Corticotropin-Releasing Hormone and Arginine Vasopressin mRNA Expression in the Stress-Responsive Neurocircuitry of Male and Female Rats Prenatally Exposed to Alcohol.Alcohol Clin Exp Res. 2015 Dec;39(12):2414-21. doi: 10.1111/acer.12916. Epub 2015 Nov 18. Alcohol Clin Exp Res. 2015. PMID: 26578428 Free PMC article.
-
Prenatal alcohol exposure alters the course and severity of adjuvant-induced arthritis in female rats.Brain Behav Immun. 2012 Mar;26(3):439-50. doi: 10.1016/j.bbi.2011.11.005. Epub 2011 Dec 1. Brain Behav Immun. 2012. PMID: 22155498 Free PMC article.
-
A review of the effects of prenatal or early postnatal ethanol exposure on brain ligand-gated ion channels.Alcohol Clin Exp Res. 2000 May;24(5):706-15. Alcohol Clin Exp Res. 2000. PMID: 10832913 Review.
-
Alcohol-induced alterations in dopamine modulation of prefrontal activity.Alcohol. 2015 Dec;49(8):773-9. doi: 10.1016/j.alcohol.2015.09.001. Epub 2015 Oct 23. Alcohol. 2015. PMID: 26558348 Free PMC article. Review.
Cited by
-
Prenatal Alcohol Exposure: Profiling Developmental DNA Methylation Patterns in Central and Peripheral Tissues.Front Genet. 2018 Dec 4;9:610. doi: 10.3389/fgene.2018.00610. eCollection 2018. Front Genet. 2018. PMID: 30568673 Free PMC article.
-
Gene expression profiling reveals a lingering effect of prenatal alcohol exposure on inflammatory-related genes during adolescence and adulthood.Cytokine. 2020 Sep;133:155126. doi: 10.1016/j.cyto.2020.155126. Epub 2020 Jun 3. Cytokine. 2020. PMID: 32505093 Free PMC article.
-
Neonatal Alcohol Exposure in Mice Induces Select Differentiation- and Apoptosis-Related Chromatin Changes Both Independent of and Dependent on Sex.Front Genet. 2020 Feb 11;11:35. doi: 10.3389/fgene.2020.00035. eCollection 2020. Front Genet. 2020. PMID: 32117449 Free PMC article.
-
Ethanol modulation of cerebellar neuroinflammation in a postnatal mouse model of fetal alcohol spectrum disorders.J Neurosci Res. 2021 Aug;99(8):1986-2007. doi: 10.1002/jnr.24797. Epub 2021 Feb 2. J Neurosci Res. 2021. PMID: 33533128 Free PMC article.
-
Prenatal alcohol exposure alters expression of genes involved in cell adhesion, immune response, and toxin metabolism in adolescent rat hippocampus.PLoS One. 2024 Jan 25;19(1):e0293425. doi: 10.1371/journal.pone.0293425. eCollection 2024. PLoS One. 2024. PMID: 38271377 Free PMC article.
References
-
- Barilla ML, Carsons SE. Fibronectin fragments and their role in inflammatory arthritis. Seminars in Arthritis and Rheumatism. 2000;29(4):252–65. - PubMed
-
- Bodnar T, Weinberg J. Prenatal Alcohol Exposure: Impact on Neuroendocrine – Neuroimmune Networks. In: Cui C, et al., editors. Neural-Immune Interactions in Brain Function. Springer Science+Business Media; New York: 2013. pp. 307–357.
-
- Borck G, Mollà-Herman A, Boddaert N, Encha-Razavi F, Philippe A, Robel L, Desguerre I, Brunelle F, Benmerah A, Munnich A, Colleaux L. Clinical, cellular, and neuropathological consequences of AP1S2 mutations: further delineation of a recognizable X-linked mental retardation syndrome. Human Mutation. 2008;29(7):966–74. - PubMed
-
- Brand JM, Frohn C, Cziupka K, Brockmann C, Kirchner H, Luhm J. Prolactin triggers pro-inflammatory immune responses in peripheral immune cells. European Cytokine Network. 2014;15(2):99–104. - PubMed
-
- Carter JL, Lubahn C, Lorton D, Osredkar T, Der TC, Schaller J, Evelsizer S, Flowers S, Ruff N, Reese B, Bellinger DL. Adjuvant-induced arthritis induces c-Fos chronically in neurons in the hippocampus. Journal of Neuroimmunology. 2011;230(1–2):85–94. - PubMed
Publication types
MeSH terms
Substances
Grants and funding
LinkOut - more resources
Full Text Sources
Other Literature Sources
Molecular Biology Databases
Research Materials
Miscellaneous
