. 2015 Jun;172(12):3126-40.
doi: 10.1111/bph.13113. Epub 2015 Apr 10.

Thalamic Kv 7 channels: pharmacological properties and activity control during noxious signal processing

Affiliations

Thalamic Kv 7 channels: pharmacological properties and activity control during noxious signal processing

Manuela Cerina et al. Br J Pharmacol. 2015 Jun.

Abstract

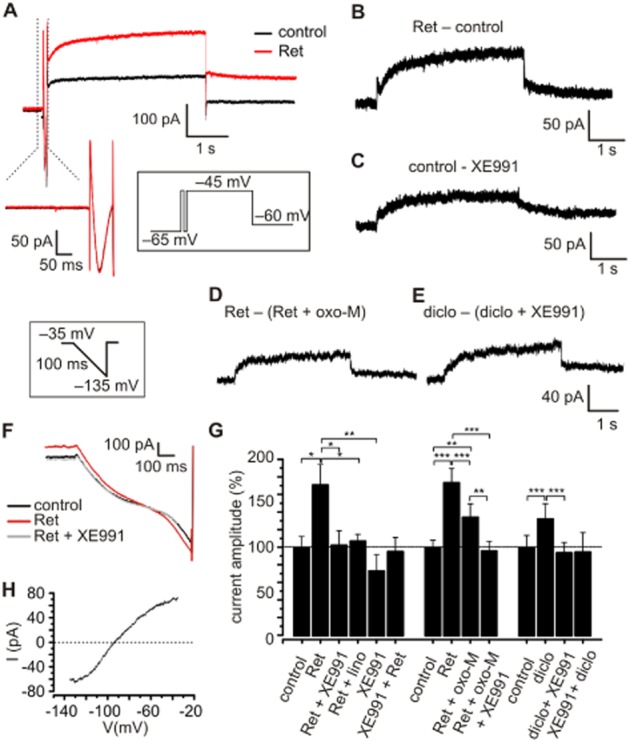
Background and purpose: The existence of functional K(v)7 channels in thalamocortical (TC) relay neurons and the effects of the K(+)-current termed M-current (I(M)) on thalamic signal processing have long been debated. Immunocytochemical evidence suggests their presence in this brain region. Therefore, we aimed to verify their existence, pharmacological properties and function in regulating activity in neurons of the ventrobasal thalamus (VB).

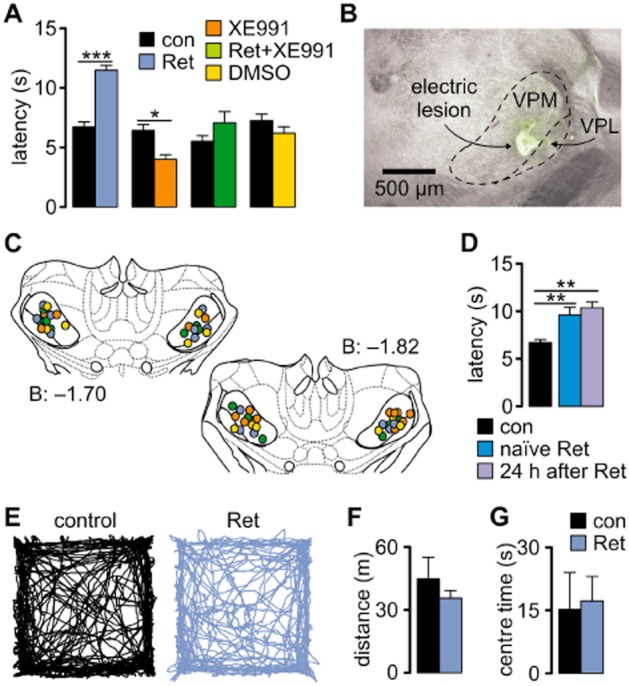
Experimental approach: Characterization of K(v)7 channels was performed by combining in vitro, in vivo and in silico techniques with a pharmacological approach. Retigabine (30 μM) and XE991 (20 μM), a specific K(v)7 channel enhancer and blocker, respectively, were applied in acute brain slices during electrophysiological recordings. The effects of intrathalamic injection of retigabine (3 mM, 300 nL) and/or XE991 (2 mM, 300 nL) were investigated in freely moving animals during hot-plate tests by recording behaviour and neuronal activity.

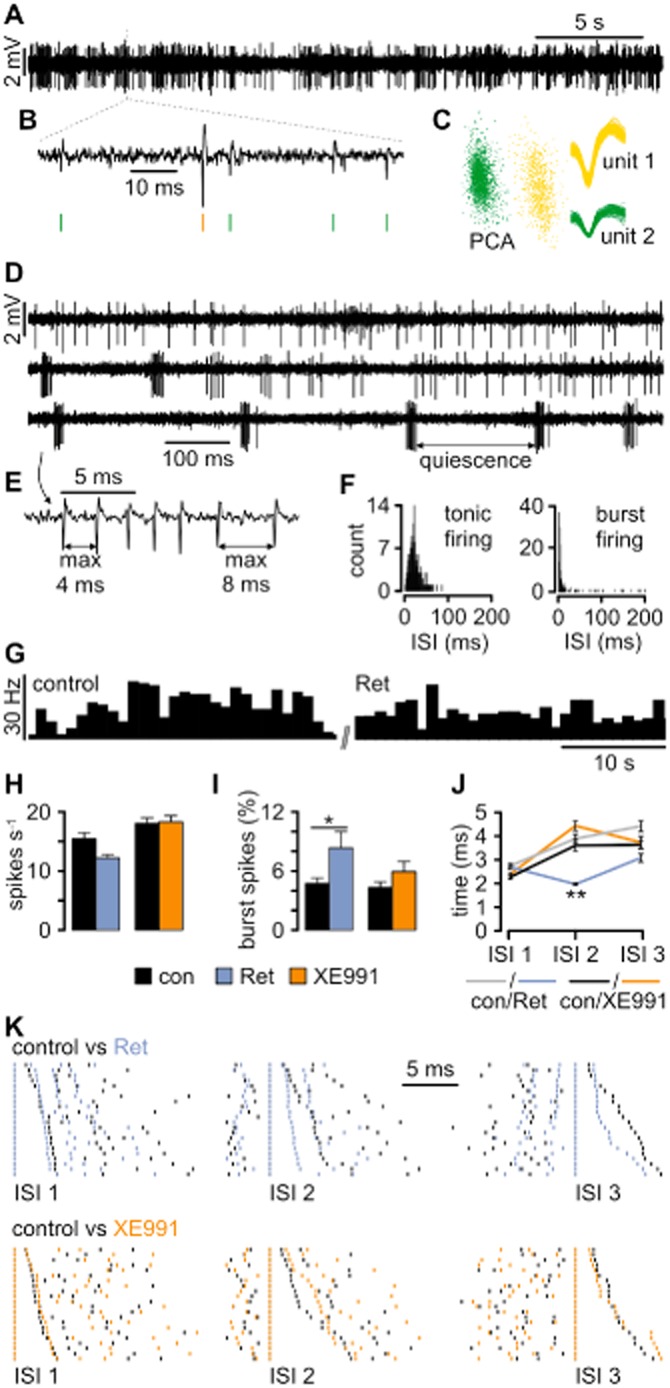
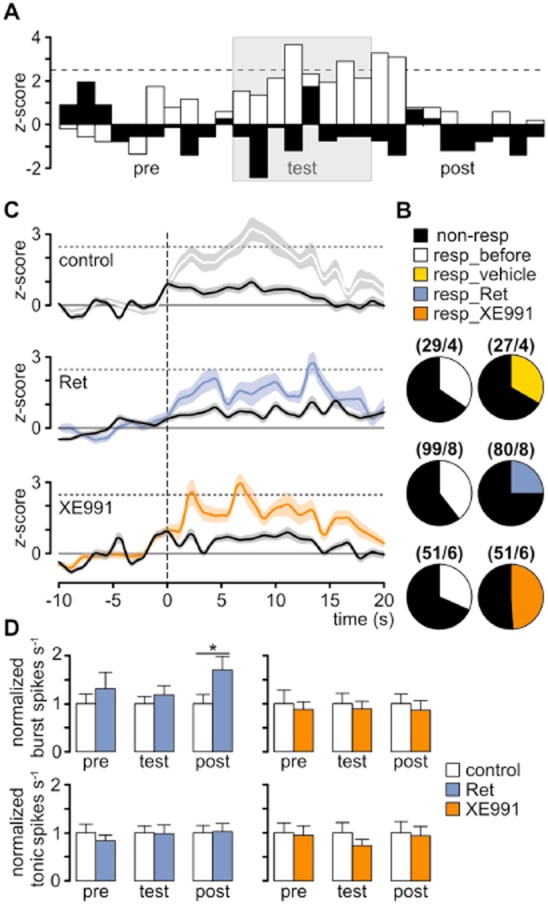
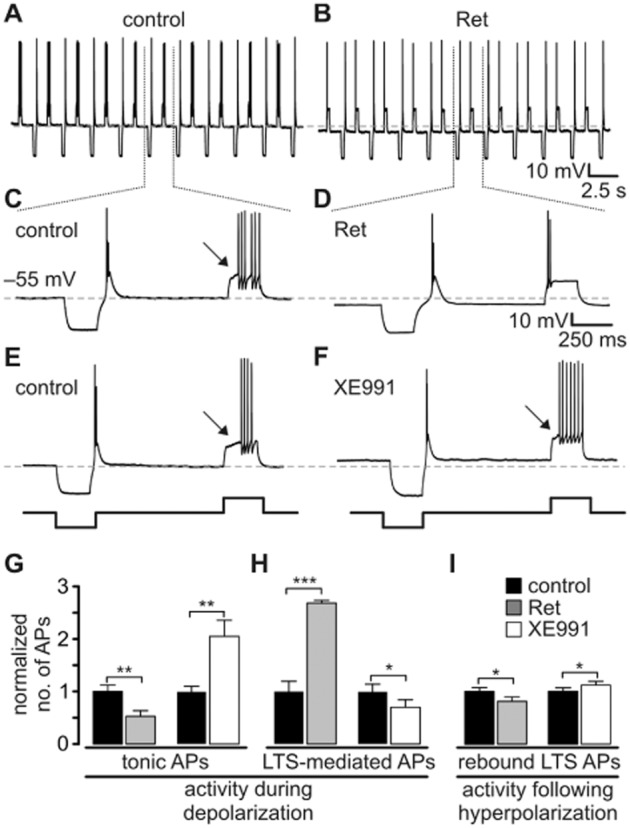
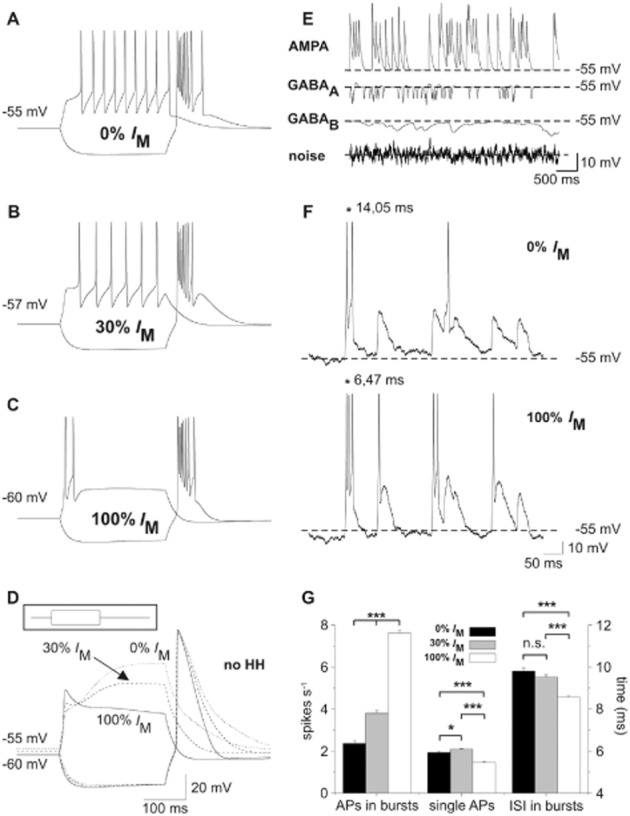
Key results: K(v)7.2 and K(v)7.3 subunits were found to be abundantly expressed in TC neurons of mouse VB. A slow K(+)-current with properties of IM was activated by retigabine and inhibited by XE991. K(v)7 channel activation evoked membrane hyperpolarization, a reduction in tonic action potential firing, and increased burst firing in vitro and in computational models. Single-unit recordings and pharmacological intervention demonstrated a specific burst-firing increase upon I(M) activation in vivo. A K(v)7 channel-mediated increase in pain threshold was associated with fewer VB units responding to noxious stimuli, and increased burst firing in responsive neurons.

Conclusions and implications: K(v)7 channel enhancement alters somatosensory activity and may reflect an anti-nociceptive mechanism during acute pain processing.


Figures

Figure 1
Figure 1
Kv7 channels influence the firing behaviour of TC neurons in vivo. (A) Representative traces recorded in VB revealing spontaneous spiking. (B) The typical waveforms of extracellularly recorded APs are visible on an expanded timescale, thereby allowing spike sorting (green and yellow vertical lines). (C) After spike extraction, waveforms were clustered and sorted into units based on principal component analysis (PCA). (D) Extracellular recording revealing the two distinct TC firing patterns: tonic firing (upper trace) characterized by single APs occurring independently of each other and burst firing (bottom trace) characterized by grouped APs and high-frequency spiking. Bursts are separated by a quiet period of at least 50 ms duration. The two firing patterns can occur concurrently (middle trace). (E) Definition of burst-firing characteristics at higher temporal resolution. (F) Distribution histograms of interspike intervals (ISIs) for tonic and burst firing calculated from adequate activity periods selected manually. Note the narrow peak (reflecting high-frequency firing) and long tail (corresponding to quiescence periods) when the recorded unit is in bursting mode. (G) An example of a firing rate histogram (bin size: 1 s) for a single unit recorded under control conditions and after local Ret injection. (H) Local Ret injection caused a slight, although not significant, decrease in the firing rate, while the injection of XE991 had no effect. (I) Burst analysis revealed that Ret application facilitated burst firing in VB neurons. The application of XE991 caused a smaller and insignificant increase. (J) Analysis of ISI within bursts (intraburst ISI) revealed that Ret application caused a highly significant shortening of the second intraburst ISI (ISI2). (K) Examples of burst ISI distribution during control conditions versus periods after drug application. Each row represents a single burst and every vertical line corresponds to a single AP recorded during the control period (black lines) and after drug injection (coloured lines). To demonstrate the difference between the ISI values, corresponding spikes within each burst were time aligned. The bursts were sorted in length, with the shortest ISI displayed in the first row and the longest in the last row. Ret considerably shortened ISI 2. Data are presented as mean ± SEM. *P < 0.05, **P < 0.01.
Figure 2
Figure 2
Kv7 channels modulate pain perception. (A) The hot-plate test showed that the latency to the appearance of pain-related behaviour was significantly increased after Ret injection, and this effect was diminished when Ret was co-applied with the Kv7-blocker XE991. The blocker alone caused a significant shortening of the latency. Specificity of drug action was tested by injecting a vehicle solution (DMSO), which did not significantly change the latency (repeated-measures anova with Newman–Keuls post hoc test). (B) Photomicrograph of a coronal section of the mouse brain, indicating the co-localization of the recording (lesion) and injection site marked by Alexa488 (green staining around the lesion; VPL, ventral posterior lateral nucleus; VPM, ventral posterior medial nucleus). (C) Schematic coronal sections through the thalamus, marking the injection/recording sites (Paxinos and Franklin, 2001). The numbers indicate the posterior distance from bregma in mm. The colour of circles corresponds to the colour of the bars and legend in A. (D) Increased latencies observed in Ret-injected animals were not a result of learning, since naïve Ret-injected animals also displayed increased latencies which differed significantly from the control group shown in A (t-test for independent samples), and the effect of Ret was long lasting (t-test for independent samples). (E) Examples of open field test traces obtained from a control and a Ret-injected animal. (F) Bar graph showing the average distance travelled by the tested animals during 10 min of open field test. (G) The level of anxiety was not different between control and Ret-injected animals (t-test for independent samples) and was measured as time spent in the centre of an open field arena during the first 5 min of the test. Data are presented as mean ± SEM. *P < 0.05, **P < 0.01, ***P < 0.001.
Figure 3
Figure 3
Kv7 channels modulate pain responses of thalamic neurons in freely moving mice. (A) In order to determine the changes in neuronal firing during aversive behaviour, firing rates of individual units were analysed relative to baseline activity in 1 s segments, 10 s before (pre), during (test), and 10 s after (post) exposing the mice to the thermal stimulus. The recorded units were classified as responsive or non-responsive based on their firing rate. Neurons were considered responsive when the calculated z-score values for the firing frequency during the pain response were higher than 2.5 times the SD of the baseline activity 10 s before the pain stimulus. A response to pain-related behaviour was observed in a subpopulation of the VB neurons. Examples of normalized time histograms illustrating the changes in the firing rate of responsive (white) and non-responsive (black) units under pre-injection conditions (bin size: 1 s). The duration of the hot-plate test is indicated by a grey background. (B) The ratio of responsive (resp) to non-responsive neurons before drug injection was ∼1:2 and was not changed after injection of vehicle. After Ret injection, this decreased to ∼1:3, while after XE991 injection it increased to ∼1:1. For every group, the total number of recorded cells/number of animals is indicated in parentheses. (C) Mean population z-scores for responsive (coloured lines) and non-responsive cells (black lines) with SEM indicated by shading. After Ret injection (middle panel), the peak of the z-score was delayed compared with control (upper panel), indicating a later response to the painful stimulus. After XE991 injection (bottom panel), this latency was reduced, indicating an earlier response to the painful stimulus. The vertical dashed line marks the start of a hot-plate test. (D) The propensity of responsive neurons to fire APs in the burst mode, but not in the tonic mode, was increased after Ret application, while XE991 did not change the firing pattern. For the testing periods, the 10 s preceding (pre) and following (post) the exposure to the hot plate was analysed. The time of exposure to the hot plate never exceeded 20 s. Data are presented as mean ± SEM. *P < 0.05.
Figure 4
Figure 4
Characterization of IM in TC neurons of the VB. (A) Representative current traces evoked by a depolarizing voltage step from −65 to −45 mV (duration 4 s) recorded under control conditions and in the presence of Ret. Each test pulse was preceded by a short depolarization (pre-pulse; −45 mV, 80 ms) in order to inactivate fast-transient Ca2+ currents which were not affected by Ret application (see magnification of the pre-pulse). (B, C) Currents activated by Ret (B) or inhibited by XE991 (C) were isolated by graphical subtraction (Ret − control; control − XE991). Subtracted currents showed a slow activation and deactivation, typical for IM. (D, E) The Ret-activated current blocked by oxo-M and the diclofenac-sensitive current revealed typical IM kinetics. (F, H) Current–voltage relationship of the Ret-sensitive current. A fast hyperpolarizing ramp, affecting only constitutively open channels, was applied under control conditions in the presence of Ret and Ret + XE991. The Ret-sensitive current was obtained by subtracting control currents from the current activated by Ret and reversed at −94.04 ± 2.8 mV (n = 9), close to the calculated EK of −103 mV. (G) Bar graph showing the changes in current amplitude (voltage steps from a holding potential of −65 to −45 mV were analysed). Ret application significantly increased the current amplitude compared with control conditions. Adding Kv7 channel blockers [XE991 or linopirdine (lino)] reversed this effect. XE991 alone (i.e. without Ret) induced a pronounced current reduction; however, this was not significant. Wash-in of XE991 before Ret application prevented current activation by Ret. The presence of the muscarinic agonist oxo-M decreased the Ret-evoked current. Diclofenac (diclo) significantly increased the current amplitude, which was abolished by adding XE991 before or after drug application. Data are presented as mean ± SEM. For Ret: repeated-measures anova: F = 4.57; P = 0.005; for oxo-M: repeated-measures anova: F = 12.29; P < 0.0001; for diclo: repeated-measures anova: F = 14.85; P = 0.0002; Newman–Keuls post hoc test: *P < 0.05, **P < 0.01, ***P < 0.001 versus respective control as suggested by the horizontal bars.
Figure 5
Figure 5
IM modulates thalamic activity modes. (A–F) TC neurons were subjected to a series of hyperpolarizing and depolarizing current steps under current-clamp conditions (±200 pA, 250 ms duration). Recordings show that Ret hyperpolarized the TC neurons, thereby reducing the number of tonic APs and favouring burst-like activity (A–D). Application of XE991 induced opposite effects on the firing pattern (E, F). (G–I) Normalized numbers of APs induced by depolarizing pulses (G, H) and subsequent to hyperpolarizing pulses (rebound burst triggered by a LTS, I). AP sequences typically following a delayed onset of firing (indicated by arrow on C, E and F) were regarded as tonic firing (G). Early firing (see D) was regarded as LTS mediated (H). Data are presented as mean ± SEM. Paired t-test, *P < 0.05, **P < 0.01, ***P < 0.001 versus respective control.
Figure 6
Figure 6
Effect of IM on the firing behaviour of a thalamocortical (TC) relay cell model. (A–C) Hyperpolarizing and depolarizing current pulses were applied in a TC neuron model (±500 pA, 250 ms, see inset in D). (B) Setting the conductance of IM to 30% of the maximal value and RMP to −57 mV using DC current injection was regarded as control condition. A depolarizing current step induced six APs. (C) An increase of IM to 100% hyperpolarized the RMP to −60 mV and shifted the mode of activity elicited by the depolarizing current pulse from tonic towards burst firing. (A) Removing IM from the computational model depolarized the RMP of the model cell to −55 mV and promoted tonic firing. (D) Hodgkin–Huxley (HH)-like conductances were set to zero (no HH-like conductances) thereby preventing AP generation. At 100% IM, a LTS is discernible at the beginning of the depolarizing step. (E) Network inputs were mimicked by adding randomly triggered excitatory and inhibitory synaptic activity, as well as by including a white noise source to the model cell. The individual effect of each of these parameters on the membrane potential is shown when all other external inputs, AP generation and IM are deactivated. Dashed lines mark the potential of −55 mV. (F) Application of all random network inputs (as shown in E) to the model cell with 0 and 100% IM revealed increased burst activity for the latter condition. While bursts of APs were triggered more frequently, single APs appeared less often. Moreover, APs within a burst were observed with reduced ISI. The asterisks in the upper and lower panel exemplarily mark the first ISI. Dashed lines mark the RMP of −55 mV. (G) The bar graph shows the rate (spikes per second) of burst-associated APs and single APs as well as the duration of the ISI (ms) calculated for the burst-associated APs only. Repeating the random network stimulation (60 s duration) 10 times revealed increased burst firing (defined as at least two APs ≤ 25 ms apart), reduced single-spike activity and reduced ISI with 100% IM. Adding 30% IM resulted in intermediate effects. *P < 0.05, ***P < 0.001.

Similar articles

Cited by

References

    1. Aiken SP, Lampe BJ, Murphy PA, Brown BS. Reduction of spike frequency adaptation and blockade of M-current in rat CA1 pyramidal neurones by linopirdine (DuP 996), a neurotransmitter release enhancer. Br J Pharmacol. 1995;115:1163–1168. - PMC - PubMed
    1. Alexander SP, Benson HE, Faccenda E, Pawson AJ, Sharman JL, Catterall WA, et al. The Concise Guide to PHARMACOLOGY 2013/14: G protein-coupled receptors. Br J Pharmacol. 2013a;170:1459–1581. - PMC - PubMed
    1. Alexander SP, Benson HE, Faccenda E, Pawson AJ, Sharman JL, Catterall WA, et al. The Concise Guide to PHARMACOLOGY 2013/14: ligand-gated ion channels. Br J Pharmacol. 2013b;170:1582–1606. - PMC - PubMed
    1. Alexander SP, Benson HE, Faccenda E, Pawson AJ, Sharman JL, Spedding M, et al. The Concise Guide to PHARMACOLOGY 2013/14: ion channels. Br J Pharmacol. 2013c;170:1607–1651. - PMC - PubMed
    1. Bezdudnaya T, Cano M, Bereshpolova Y, Stoelzel CR, Alonso J-M, Swadlow HA. Thalamic burst mode and inattention in the awake LGNd. Neuron. 2006;49:421–432. - PubMed

Publication types

LinkOut - more resources