. 2015 May 10;34(10):1659-80.
doi: 10.1002/sim.6428. Epub 2015 Feb 11.

Tests of calibration and goodness-of-fit in the survival setting

Affiliations

Tests of calibration and goodness-of-fit in the survival setting

Olga V Demler et al. Stat Med. .

Abstract

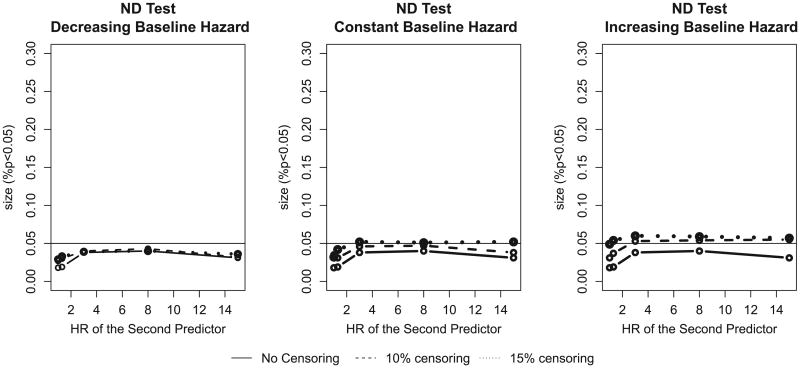
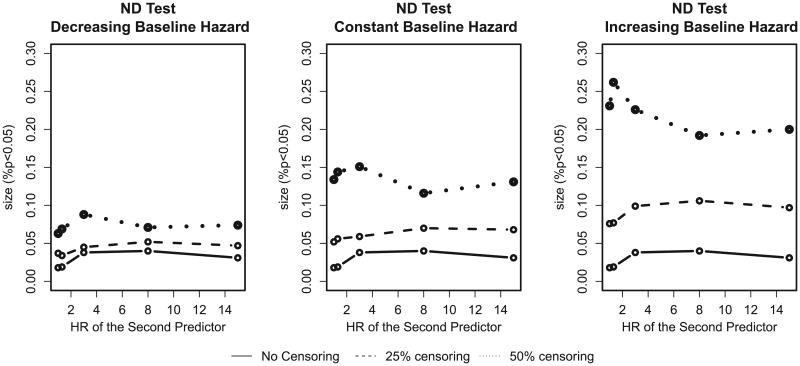
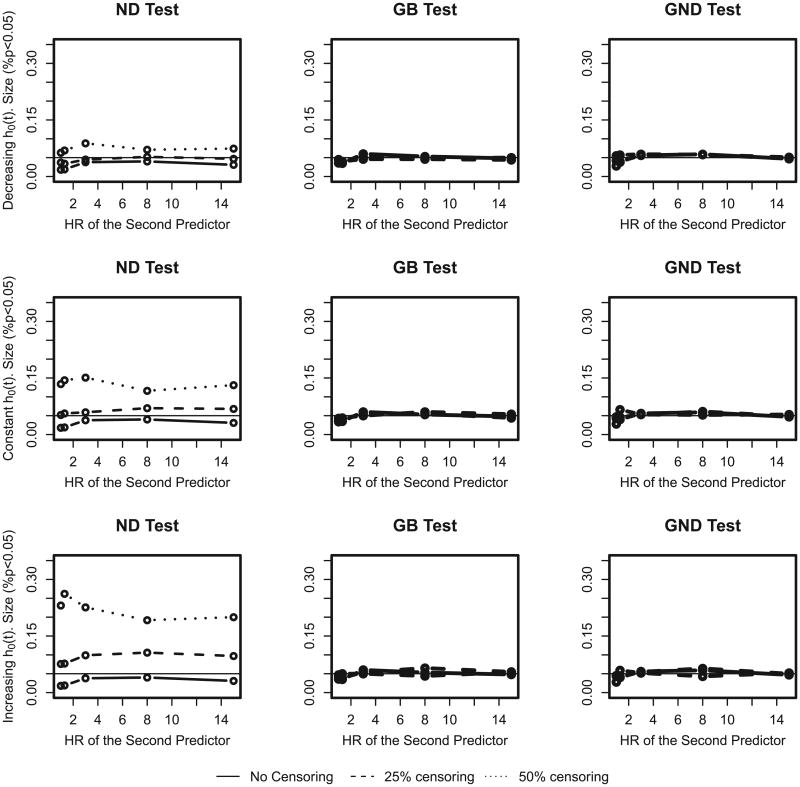
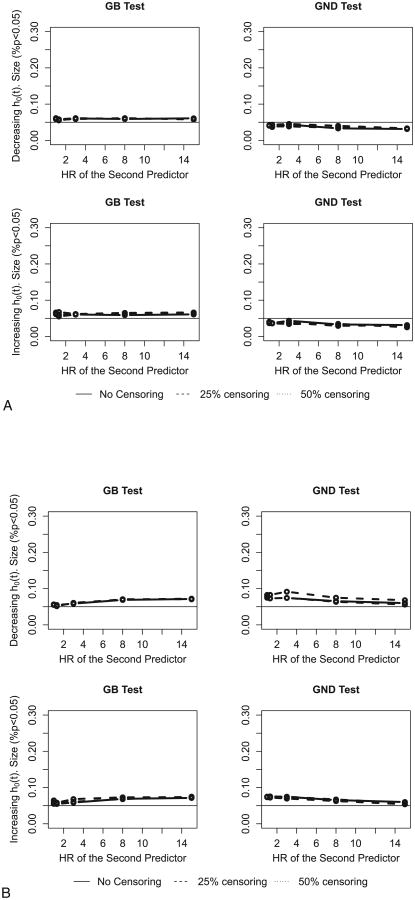
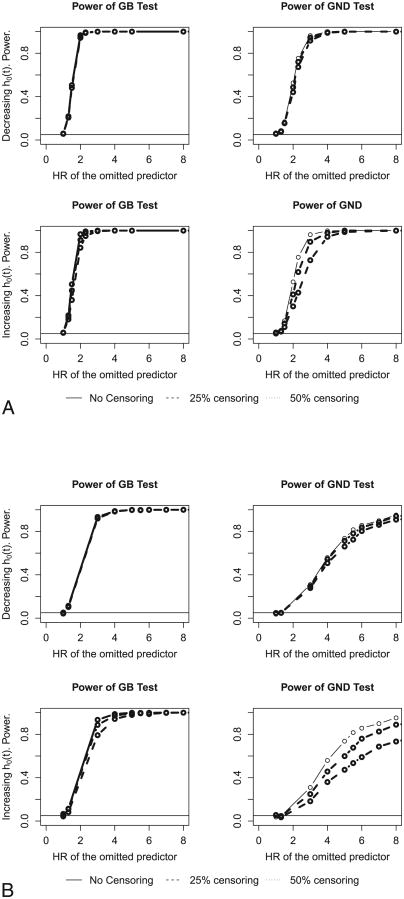
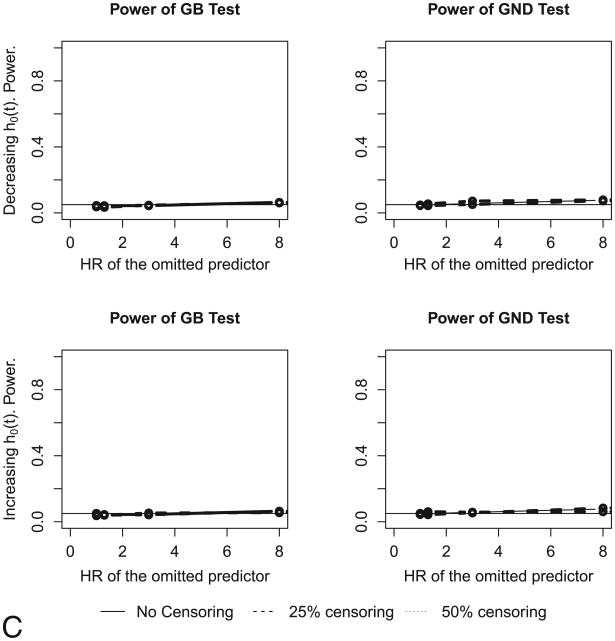
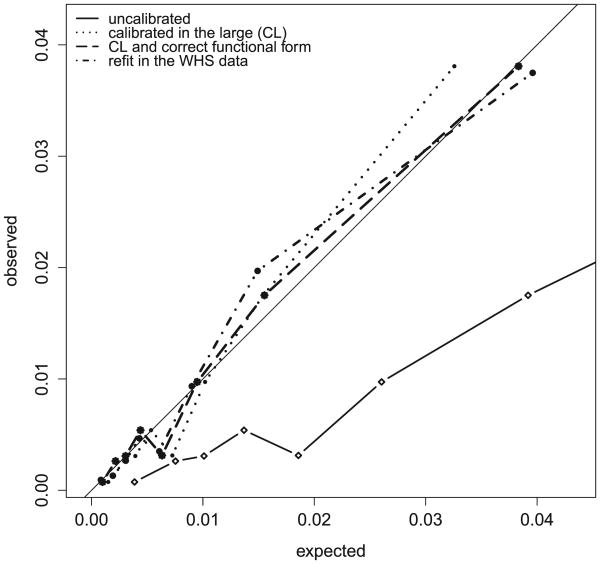
To access the calibration of a predictive model in a survival analysis setting, several authors have extended the Hosmer-Lemeshow goodness-of-fit test to survival data. Grønnesby and Borgan developed a test under the proportional hazards assumption, and Nam and D'Agostino developed a nonparametric test that is applicable in a more general survival setting for data with limited censoring. We analyze the performance of the two tests and show that the Grønnesby-Borgan test attains appropriate size in a variety of settings, whereas the Nam-D'Agostino method has a higher than nominal Type 1 error when there is more than trivial censoring. Both tests are sensitive to small cell sizes. We develop a modification of the Nam-D'Agostino test to allow for higher censoring rates. We show that this modified Nam-D'Agostino test has appropriate control of Type 1 error and comparable power to the Grønnesby-Borgan test and is applicable to settings other than proportional hazards. We also discuss the application to small cell sizes.

Keywords: calibration; goodness-of-fit; survival analysis.


Figures

Figure 1
Figure 1
The size of the Nam–D'Agostino (ND) test for a low censoring rate for decreasing, constant, and increasing baseline hazards. The population event incidence is 10%. HR, hazard ratio.
Figure 2
Figure 2
The size of the Nam–D'Agostino (ND) test for a high censoring rate for decreasing, constant, and increasing baseline hazards. The population event incidence is 10%. HR, hazard ratio.
Figure 3
Figure 3
The size of the Nam–D'Agostino (ND), Grønnesby and Borgan (GB) and proposed Greenwood–Nam–D'Agostino (GND) tests (testing deciles under the null) for decreasing (top row), constant (center), and increasing (bottom row) baseline hazards. The population event incidence rate is 10%. Deciles with less than five events were collapsed with the next neighbor. HR, hazard ratio.
Figure 4
Figure 4
A. The size of Grønnesby and Borgan (GB) and proposed Greenwood–Nam–D'Agostino (GND) tests with smaller sample size (N = 1000, p = 0.1, and at least five events per decile for decreasing (top row) and increasing (bottom row) baseline hazards. HR, hazard ratio. B. The size of Grønnesby and Borgan (GB) tests and proposed Greenwood–Nam–D'Agostino (GND) with smaller sample size (N=1000, p=0.1, and at least two events per decile for decreasing (top row) and increasing (bottom row) baseline hazards. HR, hazard ratio.
Figure 5
Figure 5
A. Power of Grønnesby and Borgan (GB) and proposed Greenwood–Nam–D'Agostino (GND) tests when missing a quadratic term. N = 5000 and p = 0.1 for decreasing (top row) and increasing (bottom row) baseline hazards. (Models 7 and 7*). HR, hazard ratio. B. Power of Grønnesby and Borgan (GB) tests and proposed Greenwood–Nam–D'Agostino (GND) tests when missing an interaction term. N = 5000 and p = 0.1 for decreasing (top row) and increasing (bottom row) baseline hazards. (Models 8 and 8*). C. Power of Grønnesby and Borgan (GB) tests and proposed Greenwood–Nam–D'Agostino (GND) tests when missing an important predictor. N = 5000 and p = 0.1 for decreasing (top row) and increasing (bottom row) baseline hazards. (Models 9 and 9*). HR, hazard ratio. HR, hazard ratio.
Figure 5
Figure 5
A. Power of Grønnesby and Borgan (GB) and proposed Greenwood–Nam–D'Agostino (GND) tests when missing a quadratic term. N = 5000 and p = 0.1 for decreasing (top row) and increasing (bottom row) baseline hazards. (Models 7 and 7*). HR, hazard ratio. B. Power of Grønnesby and Borgan (GB) tests and proposed Greenwood–Nam–D'Agostino (GND) tests when missing an interaction term. N = 5000 and p = 0.1 for decreasing (top row) and increasing (bottom row) baseline hazards. (Models 8 and 8*). C. Power of Grønnesby and Borgan (GB) tests and proposed Greenwood–Nam–D'Agostino (GND) tests when missing an important predictor. N = 5000 and p = 0.1 for decreasing (top row) and increasing (bottom row) baseline hazards. (Models 9 and 9*). HR, hazard ratio. HR, hazard ratio.
Figure 6
Figure 6
Observed probability of failure versus expected in each decile by four different recalibration strategies. ATP III model applied to women's health study (WHS) data.

References

    1. Gail MH, Brinton LA, Byar DP, Corle DK, Green SB, Schairer C, Mulvihill JJ. Projecting individualized probabilities of developing breast cancer for white females who are being examined annually. Journal of National Cancer Institute. 1989;81(24):1879–86.17. - PubMed
    1. D'Agostino RB, Vasan RS, Pencina MJ, Wolf PA, Cobain M, Massaro JM, Kannel WB. General cardiovascular risk profile for use in primary care: the Framingham heart study. Circulation. 2008;117:743–753. 14. - PubMed
    1. Anderson KM, Odell PM, Wilson PWF, Kannel WB. Cardiovascular disease risk profiles. American Heart Journal. 1991;121:293–298. 15. - PubMed
    1. Wilson PWF, D'Agostino RB, Levy D, Belanger A, Silbershatz H, Kannel WB. Prediction of coronary heart disease using risk factor categories. Circulation. 1998;97:1837–1847. - PubMed
    1. Pepe Margaret S, PhD, Janes Holly., PhD “Methods for Evaluating Prediction Performance of Biomarkers and Tests” The Selected Works of Margaret S Pepe PhD. 2013 Available at: http://works.bepress.com/margaret_pepe/38.

Publication types

LinkOut - more resources