

Causal diagrams for empirical legal research: a methodology for identifying causation, avoiding bias and interpreting results
- PMID: 25685055
- PMCID: PMC4324363
- DOI: 10.1093/lpr/mgr019
Causal diagrams for empirical legal research: a methodology for identifying causation, avoiding bias and interpreting results
Abstract
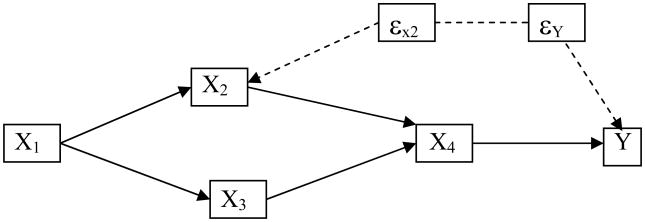
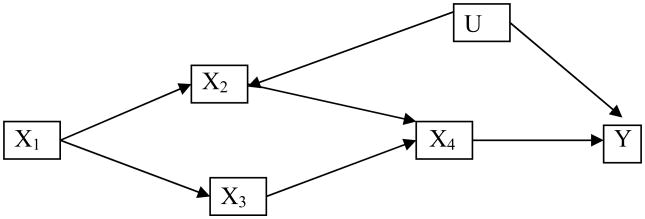
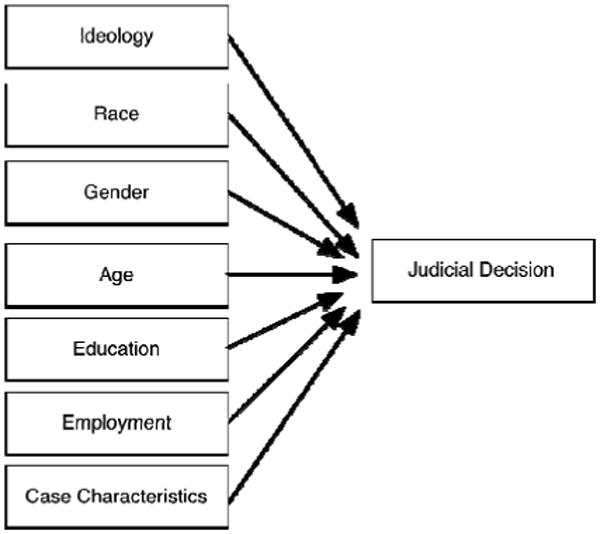
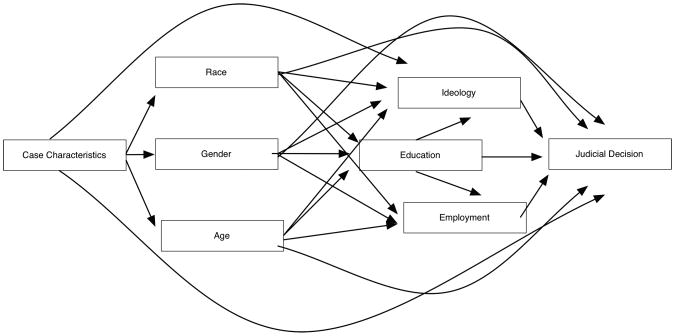
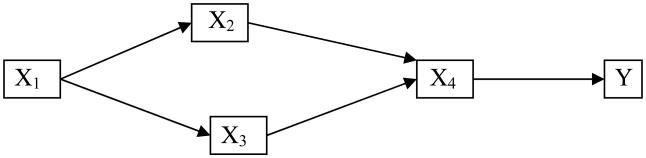
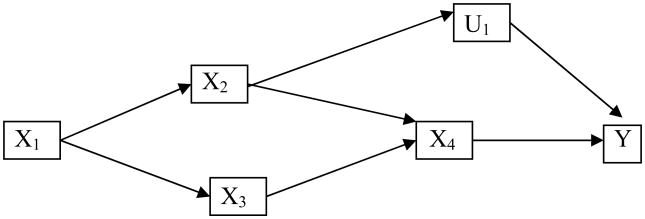
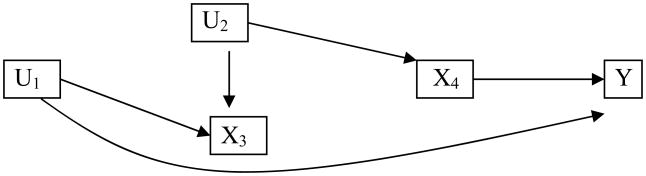
In this paper we introduce methodology-causal directed acyclic graphs-that empirical researchers can use to identify causation, avoid bias, and interpret empirical results. This methodology has become popular in a number of disciplines, including statistics, biostatistics, epidemiology and computer science, but has yet to appear in the empirical legal literature. Accordingly we outline the rules and principles underlying this new methodology and then show how it can assist empirical researchers through both hypothetical and real-world examples found in the extant literature. While causal directed acyclic graphs are certainly not a panacea for all empirical problems, we show they have potential to make the most basic and fundamental tasks, such as selecting covariate controls, relatively easy and straightforward.
Figures
Similar articles
-
Directed acyclic graphs for clinical research: a tutorial.J Minim Invasive Surg. 2023 Sep 15;26(3):97-107. doi: 10.7602/jmis.2023.26.3.97. J Minim Invasive Surg. 2023. PMID: 37712307 Free PMC article. Review.
-
An Introduction to Causal Diagrams for Anesthesiology Research.Anesthesiology. 2020 May;132(5):951-967. doi: 10.1097/ALN.0000000000003193. Anesthesiology. 2020. PMID: 32287160
-
Using Causal Diagrams for Biomedical Research.Ann Emerg Med. 2023 May;81(5):606-613. doi: 10.1016/j.annemergmed.2022.08.014. Epub 2022 Nov 1. Ann Emerg Med. 2023. PMID: 36328854
-
[Directed acyclic graphs (DAGs) - the application of causal diagrams in epidemiology].Gesundheitswesen. 2011 Dec;73(12):888-92. doi: 10.1055/s-0031-1291192. Epub 2011 Dec 22. Gesundheitswesen. 2011. PMID: 22193898 German.
-
Graphical presentation of confounding in directed acyclic graphs.Nephrol Dial Transplant. 2015 Sep;30(9):1418-23. doi: 10.1093/ndt/gfu325. Epub 2014 Oct 16. Nephrol Dial Transplant. 2015. PMID: 25324358 Review.
Cited by
-
Sex differences in the multilevel determinants of injection risk behaviours among people who inject drugs in Tijuana, Mexico.Drug Alcohol Rev. 2020 Nov;39(7):898-907. doi: 10.1111/dar.13134. Epub 2020 Aug 14. Drug Alcohol Rev. 2020. PMID: 32794626 Free PMC article.
-
The table 2 fallacy: presenting and interpreting confounder and modifier coefficients.Am J Epidemiol. 2013 Feb 15;177(4):292-8. doi: 10.1093/aje/kws412. Epub 2013 Jan 30. Am J Epidemiol. 2013. PMID: 23371353 Free PMC article.
-
Prenatal Metal Exposures and Infants' Developmental Outcomes in a Navajo Population.Int J Environ Res Public Health. 2021 Dec 31;19(1):425. doi: 10.3390/ijerph19010425. Int J Environ Res Public Health. 2021. PMID: 35010683 Free PMC article.
-
Estimating the Impact of Air Pollution on Healthcare-Seeking Behaviour by Applying a Difference-in-Differences Method to Syndromic Surveillance Data.Int J Environ Res Public Health. 2022 Jun 9;19(12):7097. doi: 10.3390/ijerph19127097. Int J Environ Res Public Health. 2022. PMID: 35742342 Free PMC article.
-
Tobacco Exposures are Associated With Healthcare Utilization and Healthcare Costs in Pregnant Persons and Their Newborn Babies.Nicotine Tob Res. 2024 Oct 22;26(11):1530-1537. doi: 10.1093/ntr/ntae128. Nicotine Tob Res. 2024. PMID: 38818778 Free PMC article.
References
-
- Cole SR, Hernán MA. Fallibility in estimating direct effects. Int'l J Epidemiology. 2002;31:163–165. - PubMed
-
- Cox Adam, Miles Thomas. Judging the Voting Rights Act. Colum L Rev. 2008;108:1–54.
-
- Davis Gary A. Bayesian Reconstruction of Traffic Accidents. Law, Probability and Risk. 2003;2:69–89.
-
- Edwards Ward. Influence Diagrams, Bayesian Imperialism, and the Collins Case: An Appeal to Reason. Cordozo Law Review. 1991;14:1025–1074.
-
- Greenland Sander, Pearl Judea, Robins James. Causal Diagrams for Epidemiologic Research. Epidemiology. 1999;10:37–48. - PubMed
Grants and funding
LinkOut - more resources
Full Text Sources